Born on February 29: About 214,000 U.S. Residents as of 2025
The Yardstick Almanac Published No substantive revisions
Short answer
Roughly 214,000 U.S. residents in 2025 were born on February 29 [estimate, range 207,000–225,000], fewer than a 1-in-1,461 calendar share gives, because 1996–2012 U.S. birth records show fewer births on that date.
Station index 6 sections
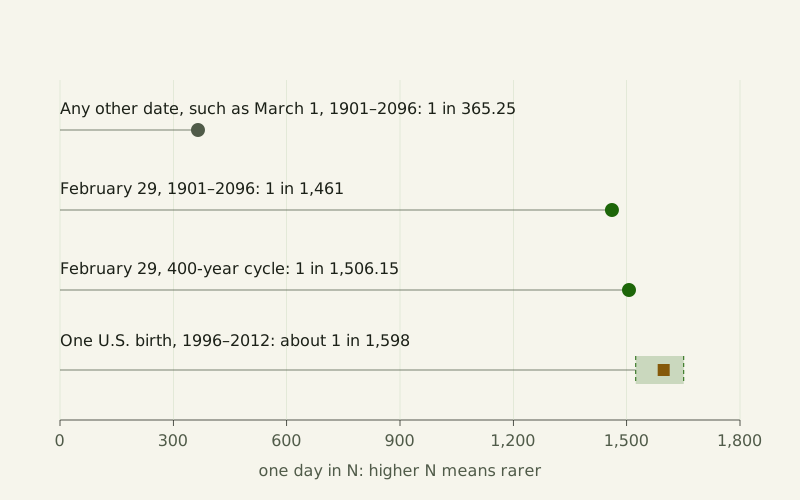
Figure: The Yardstick Almanac, CC BY 4.0
Credit line to copy
"One day in N: how rare February 29 is" by The Yardstick Almanac, https://theyardstickalmanac.com/scale/leap-day-birthdays/, licensed under CC BY 4.0 (https://creativecommons.org/licenses/by/4.0/).
Data: U.S. daily births 1994–2003 (CDC NCHS) and 2000–2014 (SSA) from the FiveThirtyEight data repository, CC BY 4.0 (adapted: birth ratios computed); computed 2026-11-01, CC BY 4.0
In five leap years of U.S. records, February 29 drew about 9% fewer births than its weekday's average [estimate, range 4–12%]. The counts come from two daily series published by FiveThirtyEight: one from the CDC's National Center for Health Statistics for 1994–2003, one from the Social Security Administration for 2000–2014. The calendar itself gives February 29 one day in every 1,461 [exact by definition] for births from 1901 through 2096. That extra day is a periodic adjustment for what we call the remainder, the part of each year that 365 whole days cannot hold, and this page counts who lands on it.
Put the calendar and the birth records together and roughly 214,000 U.S. residents have a February 29 birthday [estimate, range 207,000–225,000]. We started from the Census Bureau's Vintage 2025 estimate of 341,784,857 residents on July 1, 2025 [measured, source gives no uncertainty]. A flat share of 1 in 1,461 would give about 234,000.
Who counts, and what are the odds?
The question is narrow: how many people living in the United States on July 1, 2025, were born on a February 29. That date is the reference day of the Census estimate, so the count is as of mid-2025 and moves with each new annual vintage. The head count is about 214,000 [estimate, range 207,000–225,000], and the inputs table further down lists where every number comes from.
The odds come in two versions that answer different questions. Per calendar day, February 29 is 1 in 1,461 [exact by definition] for anyone born between 1901 and 2096. Per U.S. birth, using the 1996–2012 records, it comes out near 1 in 1,598 [estimate, range 1,524–1,651], because the date drew fewer births than comparable days.

"Der Geburtstagskuchen (The Birthday Cake)" by Eduard Geselschap, public domain
Full credit
"Der Geburtstagskuchen (The Birthday Cake)" by Eduard Geselschap — https://commons.wikimedia.org/wiki/File:Eduard_Geselschap_Der_Geburtstagskuchen_1872.jpg — Public domain (Oil on canvas by Eduard Geselschap (1814–1878), signed and dated 1872; the painter died 5 January 1878, so the work is in the public domain in the Netherlands and Germany and across the EU (life plus 70 years) and in the United States (published before 1931, per the file page). Faithful photographic reproduction of a two-dimensional public-domain work (PD-Art; EU Directive 2019/790 art. 14); the file is marked with the Public Domain Mark 1.0)
Why 1 in 1,461 and not 1 in 1,506?
The Gregorian rule makes every year divisible by 4 a leap year, except century years, which keep their leap day only if they divide by 400 (Explanatory Supplement to the Astronomical Almanac, sec. 15.4.2). The chapter's own example: 2000 was a leap year, “whereas 1900 and 2100 are not.” Over a full 400-year cycle that leaves 97 leap days in 146,097 days, or one February 29 in 1,506.15 days (rounded) [exact by definition].
Birth years from 1901 through 2096 sit inside a stretch with no skipped century year. Between March 1, 1900, and February 28, 2100, leap days arrive every 1,461 days, while an ordinary date such as March 1 turns up four times in those 1,461 days, once in 365.25 [exact by definition]. We checked every starting day in that span with two independent date routines, and every run of 1,461 consecutive days holds one February 29, never zero or two.
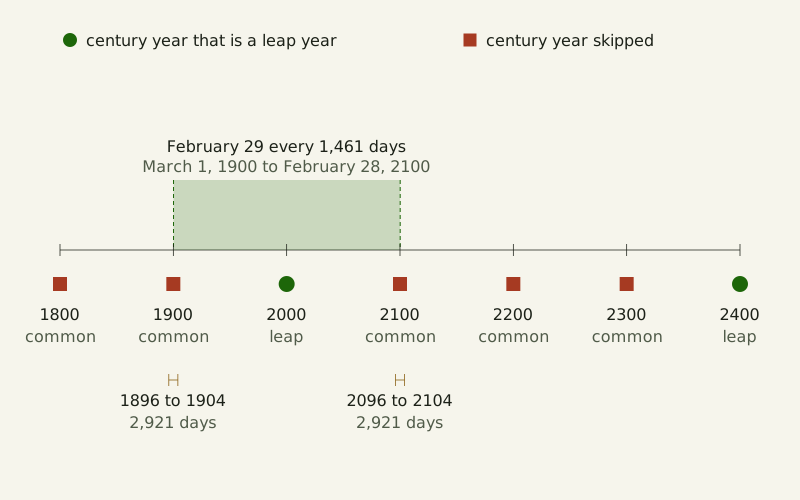
Figure: The Yardstick Almanac, CC BY 4.0
Credit line to copy
"Century years and the 1,461-day run, 1800–2400" by The Yardstick Almanac, https://theyardstickalmanac.com/scale/leap-day-birthdays/, licensed under CC BY 4.0 (https://creativecommons.org/licenses/by/4.0/).
Data: Computed from the Gregorian leap-year rule (Explanatory Supplement to the Astronomical Almanac, ch. 15, sec. 15.4.2), 2026-11-01, CC BY 4.0
The skips sit at the edges. Someone born on February 29, 1896, waited 2,921 days, eight years, for the next one in 1904. A child born on February 29, 2096, will face the same eight-year gap, because 2100 is a common year and the next leap day comes in 2104.
The Census count could in principle include someone born before 1900, but the age table cannot show it. Its top group is “100+ years,” which held 119,182 residents in 2025 [measured, source gives no uncertainty], everyone born in 1925 or earlier. The whole group adds fewer than 75 people to the estimate, so however many of them were born before 1900, the total cannot move by more than that.
Are February 29 births as common as other days?
Not in the U.S. records. A raw count is misleading here, because U.S. births swing hard by weekday: in 2004, February 29 fell on a Sunday and drew 7,301 births [measured, source gives no uncertainty], only 0.638 of that year's average day. The neighbors in 2008 show the same swing: Thursday, February 28, had 13,674 births and Saturday, March 1, had 8,832. So we compared each February 29 with the other days of the same year that fell on the same weekday, 51 days in each year, and called the result the birth ratio.
| Year | Weekday | Births on February 29 | Same-weekday average | Birth ratio | Ratio to all days |
|---|---|---|---|---|---|
| 1996 | Thursday | 10,692 | 11,649.4 | 0.918 | 1.006 |
| 2000 | Tuesday | 11,895 | 12,890.0 | 0.923 | 1.049 |
| 2004 | Sunday | 7,301 | 7,617.0 | 0.959 | 0.638 |
| 2008 | Friday | 11,631 | 13,143.3 | 0.885 | 0.988 |
| 2012 | Wednesday | 11,042 | 12,433.1 | 0.888 | 1.010 |
Every one of the five came in below its weekday average, from 0.885 in 2008 to 0.959 in 2004, with a mean of 0.914 [estimate, range 0.885–0.959]. The 1996 row comes from the CDC series, the rest from the SSA series. The records do not say why the date draws fewer births, and this page does not guess.
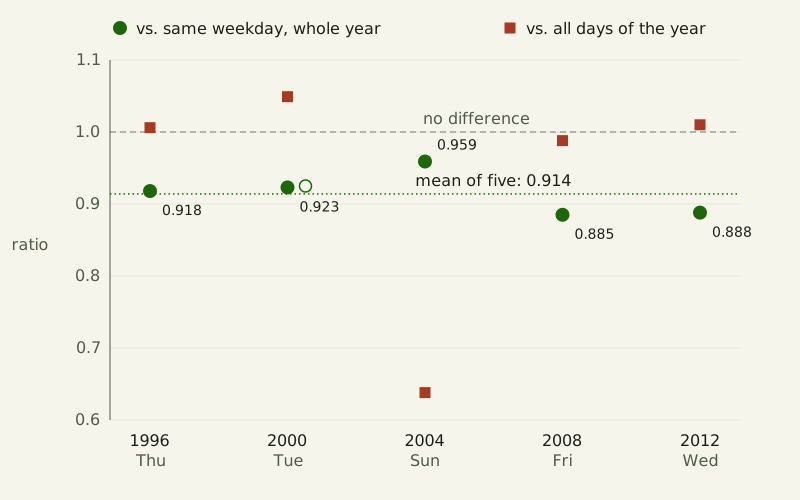
Figure: The Yardstick Almanac, CC BY 4.0
Credit line to copy
"February 29 births against the same weekday, 1996–2012" by The Yardstick Almanac, https://theyardstickalmanac.com/scale/leap-day-birthdays/, licensed under CC BY 4.0 (https://creativecommons.org/licenses/by/4.0/).
Data: U.S. daily births 1994–2003 (CDC NCHS) and 2000–2014 (SSA) from the FiveThirtyEight data repository, CC BY 4.0 (adapted: birth ratios computed); computed 2026-11-01, CC BY 4.0
For 2000 both series cover the year, so we can think of them as two benchmarks for the same station. They don't close: the SSA file counts 11,895 births on February 29 and the CDC file 11,645, a closure error, in surveyors' terms, of 250 births. The birth ratio closes almost completely, 0.923 against 0.925, so the choice of series barely moves the estimate. February 29 also rotates through the weekdays, which is why one year's raw count says little; the same 400-year cycle sets which years get an ISO week 53.
What goes into the estimate?
Three inputs carry the whole calculation. Each has a source, a data date and a limit on what it can say.
| Input | Value | Source and date | Qualifier |
|---|---|---|---|
| U.S. resident population | 341,784,857 | Census Bureau, NC-EST2025-AGESEX-RES, July 1, 2025 (Vintage 2025, released April 2026) | published without an uncertainty range |
| Share of days that are February 29 | 1 in 1,461 | Gregorian rule (Explanatory Supplement, sec. 15.4.2), counted day by day | holds for any 1,461 consecutive days from March 1, 1900, to February 28, 2100 |
| Birth ratio | 0.914 (0.885–0.959) | FiveThirtyEight births files: CDC NCHS for 1996, SSA for 2000–2012 | U.S. births only; five leap years |
The method is two multiplications, run three times. Fractions stay exact until the last rounding:
- Multiply the population by 1/1,461. That gives 233,939, the count if February 29 got an average day's share of births.
- Multiply by the mean birth ratio, 0.914 (0.91444 before rounding). That gives 213,923, rounded to 214,000.
- Repeat step 2 with the lowest ratio, 0.885 (0.88494), and the highest, 0.959 (0.95852). That gives 207,022 and 224,235, rounded outward to 207,000 and 225,000.
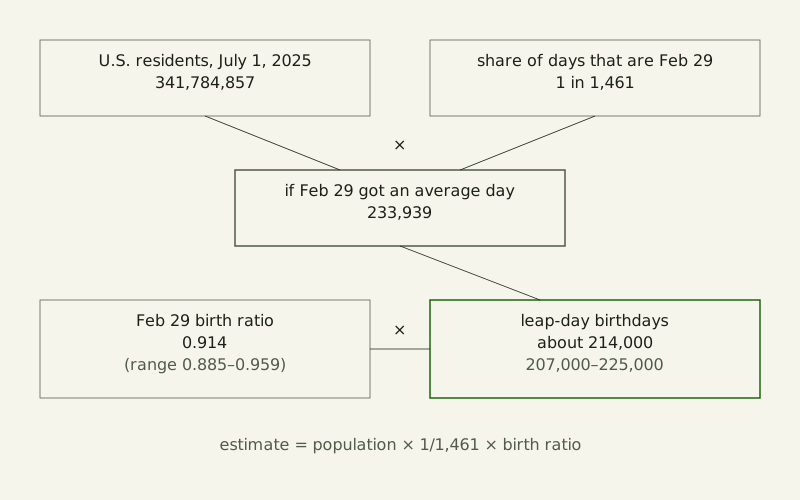
Figure: The Yardstick Almanac, CC BY 4.0
Credit line to copy
"Leap-day birthdays: the estimate as a tree" by The Yardstick Almanac, https://theyardstickalmanac.com/scale/leap-day-birthdays/, licensed under CC BY 4.0 (https://creativecommons.org/licenses/by/4.0/).
Data: U.S. daily births 1994–2003 (CDC NCHS) and 2000–2014 (SSA) from the FiveThirtyEight data repository, CC BY 4.0 (adapted: birth ratios computed); Census Bureau Vintage 2025 population by age, July 1, 2025 (public domain); computed 2026-11-01, CC BY 4.0
One assumption does most of the work. The birth ratio comes from births in 1996–2012, and we apply it to residents of every age, including those born abroad. No daily birth series we read covers them, so the 234,000 figure stays on the page as the count without any leap-day dip.
Leap-day birthday questions
When is the next February 29?
The next February 29 is Tuesday, February 29, 2028, the first leap day after 2024. After that, leap days fall every four years through 2096. Then 2100 is a common year, so the following February 29 is in 2104.
What are the odds of being born on February 29?
Per calendar day, the odds are 1 in 1,461 for anyone born between 1901 and 2096. Per birth in the U.S. records for 1996–2012, they come out near 1 in 1,598, because February 29 drew fewer births than other days on its weekday.
How often does a February 29 birthday come around?
From 1904 through 2096, February 29 comes around every four years, or every 1,461 days. Across 1900 and 2100 the wait is eight years, 2,921 days.
How wide is the band, and do other counts agree?
The band, 207,000 to 225,000 [estimate, range 207,000–225,000], is a range of inputs, not a statistical confidence interval. Its ends come from the lowest and highest yearly birth ratios. Population error is not in it, because the Census table gives no uncertainty for the total.
We also counted three other ways, and all three land inside the band. The table sets them beside the formula and the no-dip count:
| Method | Leap-day birthdays |
|---|---|
| Formula: population × mean birth ratio ÷ 1,461 | 213,923 |
| Age by age: each Census single-year age whose birth window held a February 29, divided by 366, plus the 100+ group divided by 1,461, times the mean ratio | 214,647 |
| Random draw: 20,000,000 simulated residents by Census age weights, with birth ratios drawn from the five years (sampling noise about 1%) | 213,393 |
| Direct share: February 29 births as a share of all births in four complete four-year spans, times the population | 215,414 |
| No leap-day dip: population ÷ 1,461 | 233,939 |
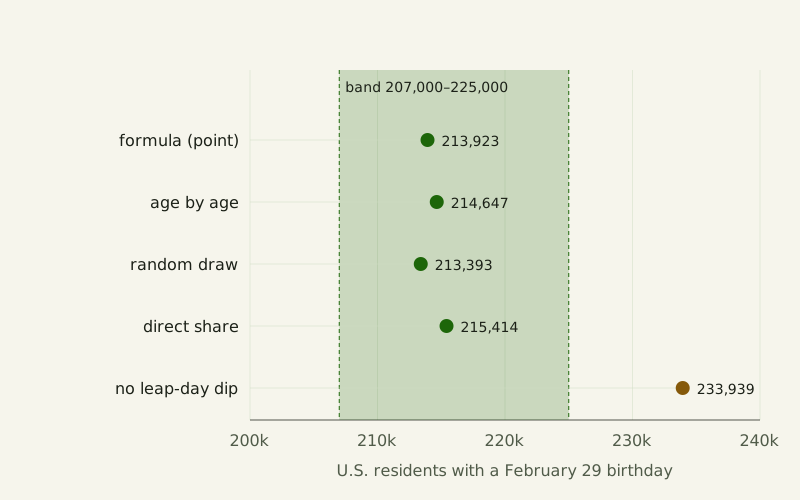
Figure: The Yardstick Almanac, CC BY 4.0
Credit line to copy
"Leap-day birthdays: band and cross-checks" by The Yardstick Almanac, https://theyardstickalmanac.com/scale/leap-day-birthdays/, licensed under CC BY 4.0 (https://creativecommons.org/licenses/by/4.0/).
Data: U.S. daily births 1994–2003 (CDC NCHS) and 2000–2014 (SSA) from the FiveThirtyEight data repository, CC BY 4.0 (adapted: birth ratios computed); Census Bureau Vintage 2025 population by age, July 1, 2025 (public domain); computed 2026-11-01, CC BY 4.0
The age-by-age count uses the Census table directly. A resident aged 1 on July 1, 2025, was born between July 2, 2023, and July 1, 2024, a window of 366 days that holds February 29, 2024. The same is true every fourth age, from 1 through 97, and those 25 ages held 85,881,501 residents. Dividing each age by 366 and adding the 100+ group at 1 in 1,461 gives 214,647 with the mean ratio, 724 more than the flat formula.
The direct share is the most literal check. Across 1996–2011, February 29 births made up 0.921 of what a flat 1-in-1,461 share would predict, close to the 0.914 mean ratio, even though it keeps each year's weekday luck.
Which input moves the answer most?
Each row below swaps one choice and leaves the rest alone. The birth ratio dominates: dropping the leap-day dip adds about 20,000 people, while the other choices move the count by a few thousand or less.
| Change | Leap-day birthdays | Difference from 213,923 |
|---|---|---|
| No leap-day dip (ratio 1) | 233,939 | +20,016 |
| Compare with all days instead of the same weekday | 219,464 | +5,541 |
| Age by age instead of a flat 1 in 1,461 | 214,647 | +724 |
| CDC count instead of SSA for 2000 | 214,020 | +97 |
| Leave out residents aged 100 and over | 213,849 | −74 |
The all-days comparison looks harmless but depends on luck: its mean of 0.938 rests on which weekdays five particular February 29s happened to fall on, and 2004's Sunday alone pulls it down.
What changes most is the denominator. “1 in 1,461” is per calendar day, and “about 1 in 1,598” is per birth: an example of what we call the unstated per, the “per something” a figure leaves out. The same missing denominator shows up in choropleth maps colored by raw counts.
Sources
- E. G. Richards, "Calendars," chapter 15 of S. E. Urban and P. K. Seidelmann (eds.), Explanatory Supplement to the Astronomical Almanac (University Science Books); online reprint, U.S. Naval Observatory. Section 15.4.2. https://aa.usno.navy.mil/downloads/c15_usb_online.pdf Read: section 15.4.2
- U.S. Census Bureau, Population Division, “Annual Estimates of the Resident Population by Single Year of Age and Sex for the United States: April 1, 2020 to July 1, 2025” (NC-EST2025-AGESEX-RES), Vintage 2025, released April 2026; file layout NC-EST2025-AGESEX-RES. https://www2.census.gov/programs-surveys/popest/datasets/2020-2025/national/asrh/nc-est2025-agesex-res.csv Read: full data file and file layout
- FiveThirtyEight, data repository, folder births/: US_births_1994-2003_CDC_NCHS.csv (from the Centers for Disease Control and Prevention, National Center for Health Statistics) and US_births_2000-2014_SSA.csv (from the Social Security Administration), data behind “Some People Are Too Superstitious To Have A Baby On Friday The 13th.” https://github.com/fivethirtyeight/data/tree/master/births Read: both data files in full, folder notes and repository license Text license: CC BY 4.0
Data files (computed 2026-11-01 from the daily birth counts, the Census Bureau's Vintage 2025 age table and the Gregorian rule, with dates checked by integer Julian Day Number arithmetic against the convertdate 2.5.1 Python package, MIT license; each file comes with a notes file giving its sources and license):
- Inputs and results of the estimate (CSV, source and license notes) Data: U.S. daily births 1994–2003 (CDC NCHS) and 2000–2014 (SSA) from the FiveThirtyEight data repository, CC BY 4.0 (adapted: birth ratios computed); Census Bureau Vintage 2025 population by age, July 1, 2025 (public domain); computed 2026-11-01, CC BY 4.0
- February 29 births against the same weekday, 1996–2012 (CSV, source and license notes) Data: U.S. daily births 1994–2003 (CDC NCHS) and 2000–2014 (SSA) from the FiveThirtyEight data repository, CC BY 4.0 (adapted: birth ratios computed); computed 2026-11-01, CC BY 4.0
- How often February 29 comes around, by span (CSV, source and license notes) Data: Computed from the Gregorian leap-year rule (Explanatory Supplement to the Astronomical Almanac, ch. 15, sec. 15.4.2), 2026-11-01, CC BY 4.0
- Four ways to count (CSV, source and license notes) Data: U.S. daily births 1994–2003 (CDC NCHS) and 2000–2014 (SSA) from the FiveThirtyEight data repository, CC BY 4.0 (adapted: birth ratios computed); Census Bureau Vintage 2025 population by age, July 1, 2025 (public domain); computed 2026-11-01, CC BY 4.0
Cite this page
The Yardstick Almanac. "Born on February 29: About 214,000 U.S. Residents as of 2025." Published November 1, 2026. https://theyardstickalmanac.com/scale/leap-day-birthdays/. Accessed [the date you read it].
More in Scale & Estimation

Scale & Estimation
Nanosecond: Light Covers About 11.8 Inches in a Vacuum
Image credit
"Commodore Grace M. Hopper, USN (covered)" by James S. Davis — https://commons.wikimedia.org/wiki/File:Commodore_Grace_M._Hopper,_USN_(covered).jpg — Public domain (work of the U.S. federal government, 17 U.S.C. §105)
Scale & Estimation
Astronomical Unit: Exactly 149,597,870,700 Meters Since 2012
Image credit
"1882 transit of venus" by US Naval Observatory — https://commons.wikimedia.org/wiki/File:1882_transit_of_venus.jpg — Public domain (work of the U.S. federal government, 17 U.S.C. §105 (the Commons file page tags it as made by U.S. Navy staff as part of official duties); independently, an anonymous work made in 1882, so any U.S. term (at most 120 years from creation for an unpublished anonymous work) and any EU term for an anonymous work have expired)

Scale & Estimation
Eratosthenes' Earth Circumference: Pliny Says 252,000 Stadia
Image credit
"View of Aswan - Along the Nile" by Antonio Beato — https://commons.wikimedia.org/wiki/File:Antonio_Beato_-_View_of_Aswan_-_Along_the_Nile_-_1993.94_-_Cleveland_Museum_of_Art.tif — CC0 1.0 (https://creativecommons.org/publicdomain/zero/1.0/); modified: converted from the 5,000 × 3,681 px TIFF original to JPEG (quality 92, same pixel size, embedded color profile kept); no crop, retouching or color change
How this page is checked: Where the numbers come from explains the value tags, the source order and how every figure is recomputed.
Corrections: every substantive change is logged in What we got wrong.
Spotted an error? Email contact@theyardstickalmanac.com with the sentence and your source, or read Write in first.