Pie Chart: A 2019 Study Says Readers Likely Judge Area
The Yardstick Almanac Published No substantive revisions
Short answer
The abstract of a 2019 preregistered study of 3D pie charts names area, not the center angle, as the most likely cue people use to read slices.
Station index 6 sections
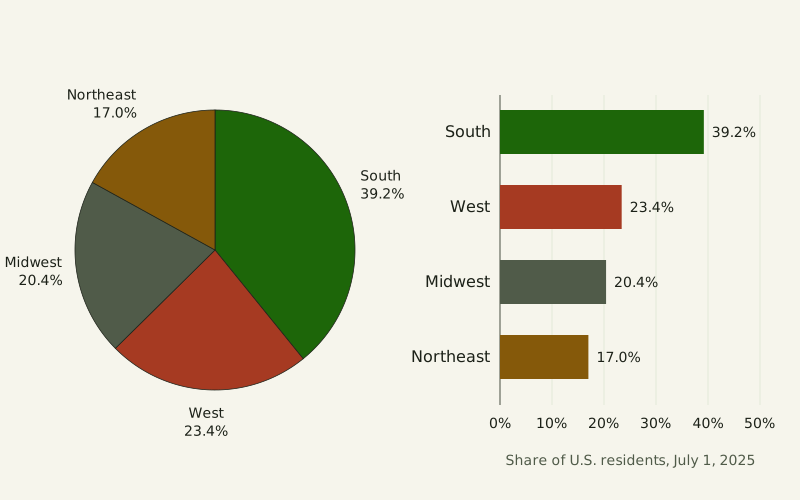
Figure: The Yardstick Almanac, CC BY 4.0
Credit line to copy
"U.S. residents by Census region as a pie and as bars" by The Yardstick Almanac, https://theyardstickalmanac.com/reading-charts/pie-chart/, licensed under CC BY 4.0 (https://creativecommons.org/licenses/by/4.0/).
Data: Computed from U.S. Census Bureau Vintage 2025 population estimates (NST-EST2025-ALLDATA, released January 2026, public domain), retrieved 2026-11-01, CC BY 4.0
Viewed from 30° above, a 25% slice at the back of a 3D pie spans 35.2% of the drawn angle. With a depth of 1/5 of the radius, the same slice covers only 20.5% of the visible ink, because the slices in front also show their sides (both figures rounded) [exact by definition]. Robert Kosara tested which cue readers go by in a preregistered study posted in 2019, and according to its abstract, “Area emerges as the most likely cue used to read pie charts.” A pie, on that reading, is a trade: it buys a picture of one whole and gives up a common baseline for the parts.
The study drew its pies in 3D with parallel projection, where, in the abstract's words, “Angle, area, and arc length differ dramatically when projected.” Comparing those changes with participants' estimates let it “rank the different visual cues by model fit.” We have read only the abstract, so this page reports no sample size or effect size from the study. Below, we take the three cues apart, show what tilt and depth do to them, rebuild one misleading pie from made-up numbers, and set out when a pie is the right chart.
What does the eye read in a pie?
A slice carries its share of the whole in three ways at once: a slice that is 25% of the whole has a center angle of 90° out of 360°, an arc that is 1/4 of the rim, and an area that is 1/4 of the disk [exact by definition]. On a flat, round pie the arc and the area grow in step with the angle, so doubling one doubles the other two. From the drawing alone, you cannot tell which cue a reader is using.
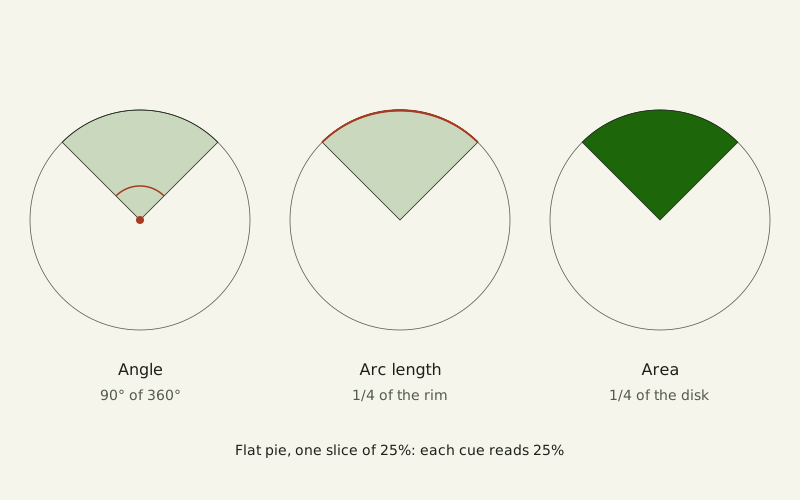
Figure: The Yardstick Almanac, CC BY 4.0
Credit line to copy
"Angle, arc length and area of a 25% slice" by The Yardstick Almanac, https://theyardstickalmanac.com/reading-charts/pie-chart/, licensed under CC BY 4.0 (https://creativecommons.org/licenses/by/4.0/).
Data: Computed from our own geometry of flat and 3D pies under parallel projection, 2026-11-01, CC BY 4.0
The bars at the top of this page carry the same shares by length from one shared baseline. In the Census example, the South held 39.2% of U.S. residents on July 1, 2025, and the Northeast 17.0% [measured, source gives no uncertainty]. The West and the Midwest sit 3.0 percentage points apart, and on the bars their ends line up against one scale.
A pie still offers something the bars do not, and one of its critics grants it. Stephen Few, who writes on business charts, granted in a 2007 newsletter that the pie's “part-to-whole relationship” message “is built right into it in an obvious way.” Few also dates the first pie chart to William Playfair's The Statistical Breviary of 1801.
What did the 2019 study test?
Kosara's study was posted as a preprint on the Open Science Framework and also appears in the proceedings of the IEEE VIS 2019 conference. Its abstract calls the study controlled and preregistered, meaning its plan was filed before the data came in. The abstract also says the study used parallel-projected 3D pie charts, and that the long-held assumption of angle as the main cue “has recently been called into question.”
Our own geometry shows why a tilted pie can pull the cues apart. Take a flat disk, view it from 30° above, and draw it with parallel projection, so the circle becomes an ellipse. A 25% slice at the front then spans 35.2% of the drawn angle and 30.1% of the drawn rim; turned to the side, the same slice spans 14.8% and 19.9% (rounded) [exact by definition]. Its area stays at 25.0% in both places, because a parallel projection shrinks every part of a flat shape by the same factor.
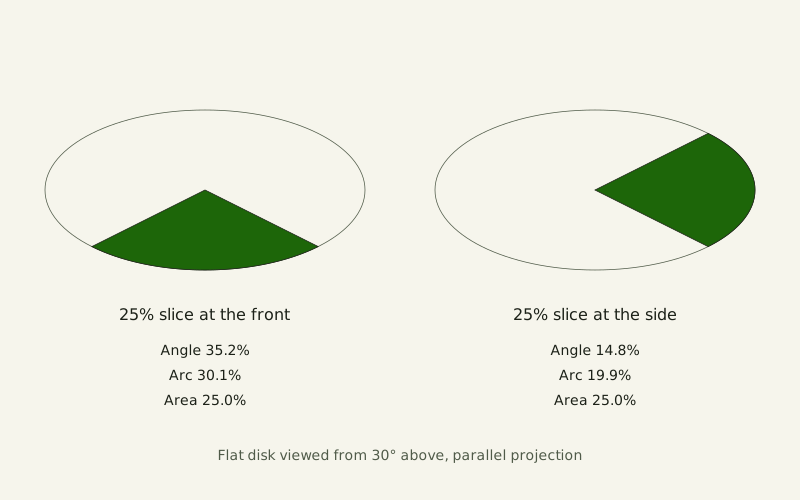
Figure: The Yardstick Almanac, CC BY 4.0
Credit line to copy
"A 25% slice on a tilted flat pie" by The Yardstick Almanac, https://theyardstickalmanac.com/reading-charts/pie-chart/, licensed under CC BY 4.0 (https://creativecommons.org/licenses/by/4.0/).
Data: Computed from our own geometry of flat and 3D pies under parallel projection, 2026-11-01, CC BY 4.0
A reader going by angle would call the front slice about 35% and the side slice about 15%, while a reader going by area would call both of them 25%. The abstract does not say how thick the study's pies were or which views it used, so this figure shows the idea, not the study's own stimuli.
Four earlier papers have titles that name graph perception, displaying proportions, and arcs, angles and areas. We have only their bibliographic records, so the table lists them without describing their findings.
| Paper | What we read | Used on this page for |
|---|---|---|
| Kosara 2019, OSF preprint; IEEE VIS 2019, pages 101–105 | Abstract only | Area as the most likely cue, in the abstract's words |
| Skau and Kosara 2016, Computer Graphics Forum, “Arcs, Angles, or Areas” | Bibliographic record only | Not used |
| Spence and Lewandowsky 1991, Applied Cognitive Psychology | Bibliographic record only | Not used |
| Simkin and Hastie 1987, Journal of the American Statistical Association | Bibliographic record only | Not used |
| Cleveland and McGill 1984, Journal of the American Statistical Association | Bibliographic record only | Not used |
Why does a 3D pie mislead?
Give the pie depth, and area stops matching the share as well. Front slices show a strip of side wall below their top face. Slices at the back show none. With a depth of 1/5 of the radius and a 30° view, a 25% slice at the front takes 33.3% of the visible area, and the same slice at the back takes 20.5% (rounded) [exact by definition].
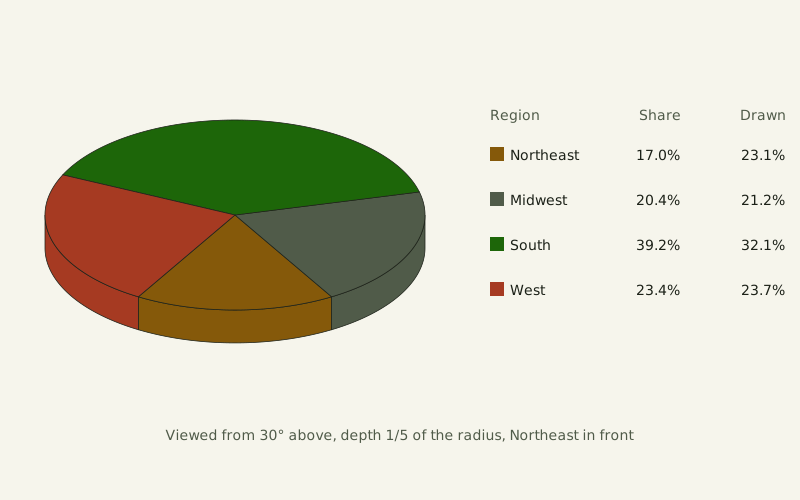
Figure: The Yardstick Almanac, CC BY 4.0
Credit line to copy
"Census regions as a 3D pie" by The Yardstick Almanac, https://theyardstickalmanac.com/reading-charts/pie-chart/, licensed under CC BY 4.0 (https://creativecommons.org/licenses/by/4.0/).
Data: Computed from our own geometry of flat and 3D pies under parallel projection, 2026-11-01, CC BY 4.0
In the Census pie, the Northeast holds 17.0% of residents but 23.1% of the drawn area, and the South, at the back, falls from 39.2% to 32.1% (rounded), with the resident shares taken from Census estimates [measured, source gives no uncertainty]. Drawn this way, the South covers 1.39 times the Northeast's area, though it has 2.31 times the residents. If readers go by area, as the 2019 abstract suggests, that is the ratio a 3D pie hands them. Few made the same point in 2007 about a tilted pie of his own: “The green slice now appears greater than it actually is, because of the depth that’s been added.”
The lower the view, the larger the effect. This table gives the visible-area share of one 25% slice, depth 1/5 of the radius:
| View from above | Slice at the front | Slice at the side | Slice at the back |
|---|---|---|---|
| 90° (flat pie) | 25.0% | 25.0% | 25.0% |
| 60° | 28.1% | 24.3% | 23.3% |
| 45° | 30.2% | 23.8% | 22.2% |
| 30° | 33.3% | 23.1% | 20.5% |
| 20° | 36.8% | 22.3% | 18.5% |
| 10° | 44.2% | 20.7% | 14.5% |
At a 10° view, the front slice takes 1.77 times its share of the area. A flat pie seen straight on is the only row where every slice gets the area it is owed.
The reason is simple geometry: the side wall's drawn height is the depth times the cosine of the view angle, so a lower view makes the strip taller while it flattens the top face. The person drawing the chart also decides which slice sits in front. Rotate the same pie, and the extra area moves to a different slice.
When do the slices not make one whole?
A pie promises that its slices add up to one whole. A pick-all-that-apply survey quietly breaks that promise. In our made-up example, 200 people answer “Which apps do you use?” and may pick more than one: Email gets 170 picks, Calendar 120, Chat 90 and Notes 40, for 420 answers in all.
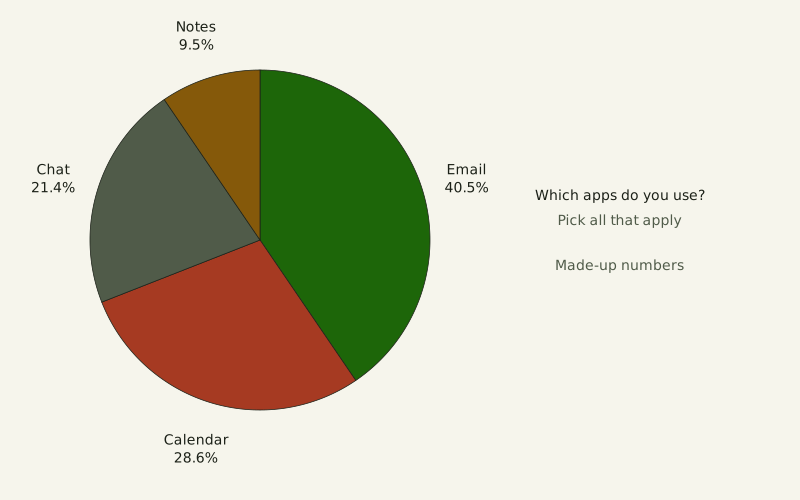
Figure: The Yardstick Almanac, CC BY 4.0
Credit line to copy
"Made-up survey drawn as a pie" by The Yardstick Almanac, https://theyardstickalmanac.com/reading-charts/pie-chart/, licensed under CC BY 4.0 (https://creativecommons.org/licenses/by/4.0/).
Data: Made-up numbers for illustration, The Yardstick Almanac, 2026-11-01, CC BY 4.0
Drawn as a pie, Email becomes 40.5% and Notes 9.5%, and the chart invites the reading “40.5% of people use Email,” but each slice is a share of answers, not of people. That gap is what we call the unstated per, the “per” a number leaves out. Counted per respondent instead, 85% use Email and 20% use Notes.
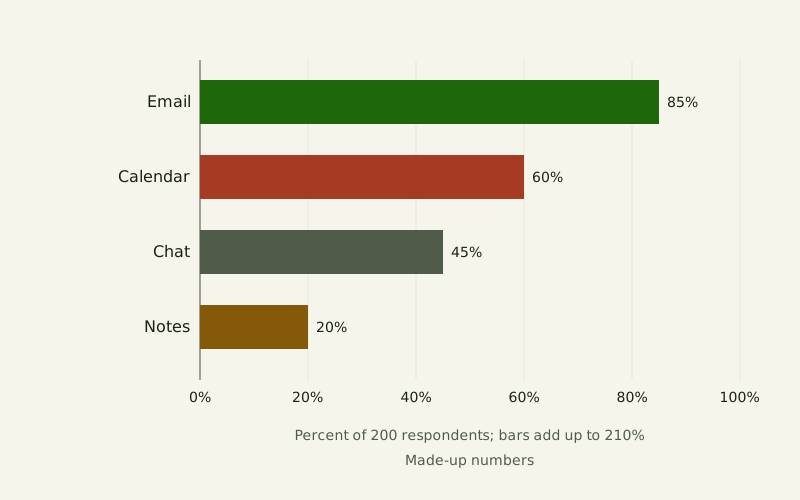
Figure: The Yardstick Almanac, CC BY 4.0
Credit line to copy
"Made-up survey drawn as bars" by The Yardstick Almanac, https://theyardstickalmanac.com/reading-charts/pie-chart/, licensed under CC BY 4.0 (https://creativecommons.org/licenses/by/4.0/).
Data: Made-up numbers for illustration, The Yardstick Almanac, 2026-11-01, CC BY 4.0
| App | Picks | Percent of 200 respondents | Percent of 420 answers, as in the pie |
|---|---|---|---|
| 170 | 85% | 40.5% | |
| Calendar | 120 | 60% | 28.6% |
| Chat | 90 | 45% | 21.4% |
| Notes | 40 | 20% | 9.5% |
The bars add up to 210%, and that total is the clue. Each person picked 2.1 apps on average, so the people form no single whole for a pie to divide. A single-answer question would be different. If each of the 200 people had named only one main app, the counts would add up to 200, the shares to 100%, and a pie would draw a true whole.
How many slices is too many?
The number of slices changes what the eye has to compare. With two slices of 60 and 40, or three of 50, 30 and 20, each slice differs from the next by at least 10 points, which is 36° of angle [exact by definition]. With seven slices running from 18 down to 12, neighbors differ by 0 to 2 points, at most 7.2° of angle, everywhere but the seam where the last slice meets the first. On bars, the same seven values sit on one baseline with their ends side by side.
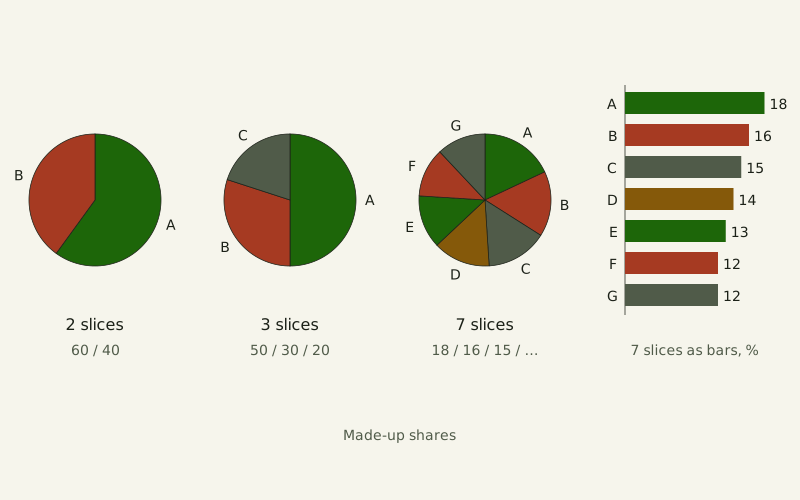
Figure: The Yardstick Almanac, CC BY 4.0
Credit line to copy
"Pies with 2, 3 and 7 slices" by The Yardstick Almanac, https://theyardstickalmanac.com/reading-charts/pie-chart/, licensed under CC BY 4.0 (https://creativecommons.org/licenses/by/4.0/).
Data: Made-up numbers for illustration, The Yardstick Almanac, 2026-11-01, CC BY 4.0
Position: the pie chart is not guilty. With two or three parts, when the point is each part's share of one whole, a pie is a sound choice, and a rule against every pie is a matter of taste. The limit: past five slices, or when several groups must be compared side by side, switch to bars. That is this site's editorial judgment, not a research result, because we have not read the full text of any experiment comparing how well people read pies and bars, and the 2019 abstract is about which cue people use, not about which chart wins.
Few takes the opposite position in “Save the Pies for Dessert,” his 2007 newsletter. He called the pie chart “by far the least effective” of the major chart types and wrote that bar graphs “provide a much better means to compare the magnitudes of each part.” He also granted the pie its part-to-whole message, which is the one case where this site still reaches for a pie.
Pie chart or bar chart?
The two charts answer different questions about the same proportions. A bar is read against a scale the way a length is read against a ruler, and how the American ruler itself is pinned to the meter is the subject of the metric system in the U.S.. The table sets out the cases on this page; rows marked as position are the site's judgment, and the rest follow from geometry, from Few's newsletter or from the examples above.
Illustration: The Yardstick Almanac. Generated schematic illustration — not a photograph or historical record. © The Yardstick Almanac, all rights reserved.
| Situation | Pie chart | Bar chart |
|---|---|---|
| Showing that parts make one whole | Built into the shape | Needs a percent axis or a title that names the whole |
| Ranking parts that are close in size | No shared baseline; compare angles or areas | Ends sit on one baseline |
| More than five parts (position) | Switch to bars | Works |
| Several groups compared (position) | Switch to bars | Works side by side |
| Picks that add up to more than 100% | Misleading: no single whole of people | Works as percent of respondents |
| Drawn tilted or in 3D | Tilt moves angle and arc away from area; depth also gives front slices extra area | Depth distorts bars too |
Five questions catch the problems shown on this page. They work whether you are reading someone else's pie or drawing your own:
- Do the parts add up to one whole? If the total is more than 100%, a bar chart of percentages is the honest choice.
- How many slices are there? Beyond five, this site's position is to switch to bars.
- Is the pie tilted or given depth? Draw it flat and viewed from directly above, where every slice gets its true angle and area.
- Is the whole named? The title or the card should state what the slices are a share of.
- Are the slices close in size? Compare the printed percentages, not the shapes, when neighbors differ by a few points.
Bars are not free of traps either. A cut axis or a second value axis can mislead too, and both are taken apart on daylight data in daylight hours by latitude.
Sources
- U.S. Census Bureau, Population Division, Annual Population Estimates, Estimated Components of Resident Population Change, and Rates of the Components of Resident Population Change for the United States, States, District of Columbia, and Puerto Rico: April 1, 2020 to July 1, 2025 (NST-EST2025-ALLDATA), Vintage 2025, released January 2026. https://www2.census.gov/programs-surveys/popest/datasets/2020-2025/state/totals/NST-EST2025-ALLDATA.csv Read: full data file
- U.S. Census Bureau, Population Division, NST-EST2025-ALLDATA file layout (data fields and periods), Vintage 2025. https://www2.census.gov/programs-surveys/popest/technical-documentation/file-layouts/2020-2025/NST-EST2025-ALLDATA.pdf Read: full document
- Robert Kosara, “Evidence for Area as the Primary Visual Cue in Pie Charts,” OSF preprint, posted October 17, 2019, doi:10.31219/osf.io/fcna4. Also published in 2019 IEEE Visualization Conference (VIS), 101–105, doi:10.1109/visual.2019.8933547. https://doi.org/10.31219/osf.io/fcna4 Read: abstract only
- Stephen Few, “Save the Pies for Dessert,” Visual Business Intelligence Newsletter, Perceptual Edge, August 2007. https://www.perceptualedge.com/articles/visual_business_intelligence/save_the_pies_for_dessert.pdf Read: full text
- Drew Skau and Robert Kosara, “Arcs, Angles, or Areas: Individual Data Encodings in Pie and Donut Charts,” Computer Graphics Forum 35, no. 3 (2016): 121–130. doi:10.1111/cgf.12888. https://doi.org/10.1111/cgf.12888 Read: bibliographic record only
- Ian Spence and Stephan Lewandowsky, “Displaying proportions and percentages,” Applied Cognitive Psychology 5, no. 1 (1991): 61–77. doi:10.1002/acp.2350050106. https://doi.org/10.1002/acp.2350050106 Read: bibliographic record only
- David Simkin and Reid Hastie, “An Information-Processing Analysis of Graph Perception,” Journal of the American Statistical Association 82, no. 398 (1987): 454–465. doi:10.1080/01621459.1987.10478448. https://doi.org/10.1080/01621459.1987.10478448 Read: bibliographic record only
- William S. Cleveland and Robert McGill, “Graphical Perception: Theory, Experimentation, and Application to the Development of Graphical Methods,” Journal of the American Statistical Association 79, no. 387 (1984): 531–554. doi:10.1080/01621459.1984.10478080. https://doi.org/10.1080/01621459.1984.10478080 Read: bibliographic record only
Data files (computed 2026-11-01 from the U.S. Census Bureau's Vintage 2025 national and state population estimates file, a public-domain federal dataset released in January 2026, and from our own geometry of flat and 3D pies under parallel projection; shares are exact fractions, and every value was checked by a second independent calculation and against the drawn charts; the survey and slice-count numbers are made up for illustration):
- U.S. residents by Census region, July 1, 2025: counts, shares and pie angles (CSV, source and license notes) Data: Computed from U.S. Census Bureau Vintage 2025 population estimates (NST-EST2025-ALLDATA, released January 2026, public domain), retrieved 2026-11-01, CC BY 4.0
- Drawn angle, arc and area shares of a 25% slice by view and position, and the 3D Census pie (CSV, source and license notes) Data: Computed from our own geometry of flat and 3D pies under parallel projection, 2026-11-01, CC BY 4.0
- Made-up survey and slice-count examples (CSV, source and license notes) Data: Made-up numbers for illustration, The Yardstick Almanac, 2026-11-01, CC BY 4.0
- The pie chart studies cited here and how much of each was read (CSV, source and license notes) Data: Study details transcribed from the abstract of Kosara 2019 and from Crossref bibliographic records, 2026-11-01, CC BY 4.0
Cite this page
The Yardstick Almanac. "Pie Chart: A 2019 Study Says Readers Likely Judge Area." Published November 1, 2026. https://theyardstickalmanac.com/reading-charts/pie-chart/. Accessed [the date you read it].
More in Reading Charts
Reading Charts
Daylight Hours: 70° N Averaged More Than the Equator in 2026
Image credit
"Summer Night, Raftsundet, Lofoten" by Adelsteen Normann — https://commons.wikimedia.org/wiki/File:Adelsteen_Normann_-_Sommernatt_i_Raftsund_-_TKM-29-1887_-_Trondheim_kunstmuseum_(cropped).jpg — Public domain (Oil on canvas by Adelsteen Normann (1848–1918), Trondheim Art Museum TKM-29-1887, dated presumably 1887 on the Commons file page; the painter died 26 December 1918, so the work is in the public domain in Norway and the EU (life plus 70 years) and in the United States (published before 1931, per the file page). Faithful photographic reproduction of a two-dimensional public-domain work (PD-Art); the file is marked with the Public Domain Mark 1.0); modified: cropped to the painting by a Commons contributor (CropTool, lossless) from the framed museum photograph; used unchanged
Reading Charts
Misleading Graphs: In Tests, Even Flagged Cut Axes Misled
Illustration credit
Illustration: The Yardstick Almanac. Generated schematic illustration — not a photograph or historical record. © The Yardstick Almanac, all rights reserved.
How this page is checked: Where the numbers come from explains the value tags, the source order and how every figure is recomputed.
Corrections: every substantive change is logged in What we got wrong.
Spotted an error? Email contact@theyardstickalmanac.com with the sentence and your source, or read Write in first.