Daylight Hours: 70° N Averaged More Than the Equator in 2026
The Yardstick Almanac Published No substantive revisions
Short answer
By the standard sunrise definition, 70° N averaged about 12.58 hours of daylight a day in 2026 to the equator's 12.12, helped by slanting sunrises and a longer northern half-year.
Station index 11 sections
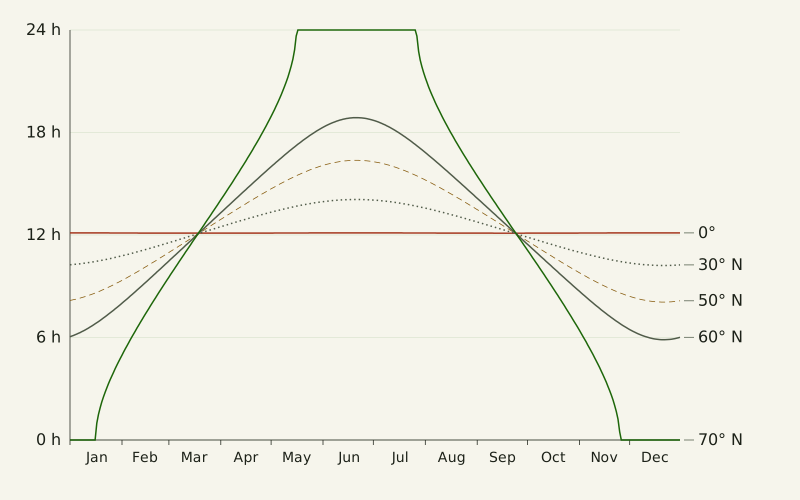
Figure: The Yardstick Almanac, CC BY 4.0
Credit line to copy
"Daylight through 2026 at five latitudes" by The Yardstick Almanac, https://theyardstickalmanac.com/reading-charts/daylight-hours-by-latitude/, licensed under CC BY 4.0 (https://creativecommons.org/licenses/by/4.0/).
Data: Daylight hours computed for 2026 from the USNO sunrise definition with the Meeus solar equations and the JPL DE440s ephemeris, 2026-11-01, CC BY 4.0
Averaged over 2026, 70° N got about 12.58 hours of daylight a day [estimate, range 12.55–12.61 h], about 28 minutes more than the equator. The figure comes from the sunrise definition of the United States Naval Observatory (USNO): the Sun is up while its center is less than 50 arcminutes below the horizon [exact by definition]. We computed every date of 2026 two independent ways, with the Meeus equations behind NOAA's solar calculator and JPL's DE440 ephemeris. This page is about a choice, not a leftover: the standard definition counts the Sun's top edge, lifted by the air, and that choice is part of why the Arctic comes out ahead.
At the equator the same year averaged about 12.12 hours a day [estimate, range 12.08–12.15 h]. Of the latitudes we computed every 5 degrees from the equator to the North Pole, 70° N had the highest yearly average. It reached that average the hard way: 52 days with no daylight at all and 71 days with 24 hours of daylight.
Which latitude gets the most daylight over a year?
The yearly averages climb slowly from the equator and then jump between 60° N and 65° N. In 2026, 30° N averaged 12.17 hours, 50° N 12.26 hours and 60° N 12.38 hours. The value at 65° N was 12.56 hours, and 70° N topped the list at 12.58. Farther north the average slipped a little, to 12.54 hours at the North Pole.
Every latitude in the north averaged more than 12 hours. Two separate things add time. The standard sunrise counts the top edge of a lifted Sun, which adds minutes at every sunrise and every sunset, and between the 2026 equinoxes the Sun spent about 186.4 days north of the equator, against about 178.8 south of it until the next March.
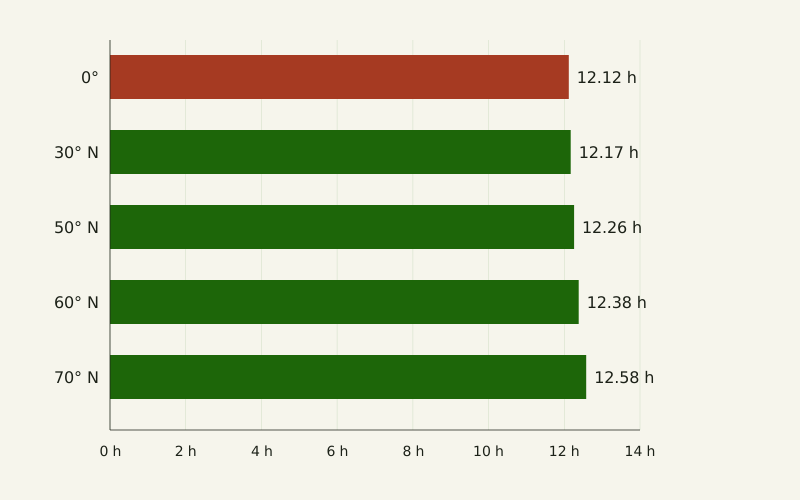
Figure: The Yardstick Almanac, CC BY 4.0
Credit line to copy
"Average daylight per day, 2026" by The Yardstick Almanac, https://theyardstickalmanac.com/reading-charts/daylight-hours-by-latitude/, licensed under CC BY 4.0 (https://creativecommons.org/licenses/by/4.0/).
Data: Daylight hours computed for 2026 from the USNO sunrise definition with the Meeus solar equations and the JPL DE440s ephemeris, 2026-11-01, CC BY 4.0
| Latitude | Average per day, 2026 | Shortest day | Longest day | Days with no daylight | Days with 24 hours of daylight |
|---|---|---|---|---|---|
| 0° | 12.12 h | 12.11 h | 12.13 h | 0 | 0 |
| 30° N | 12.17 h | 10.22 h | 14.08 h | 0 | 0 |
| 50° N | 12.26 h | 8.07 h | 16.37 h | 0 | 0 |
| 60° N | 12.38 h | 5.87 h | 18.87 h | 0 | 0 |
| 70° N | 12.58 h | 0.00 h | 24.00 h | 52 | 71 |
| 90° N | 12.54 h | 0.00 h | 24.00 h | 173 | 190 |
The annual file has the same columns for every 5 degrees from the South Pole to the North Pole. Our two computations of the standard-definition hours match within 47.1 seconds on every date at the five latitudes in the chart. As an outside check, USNO's table of day and night lengths gives a longest day of 18h 53m and a shortest of 5h 52m at 60° N; ours are 18h 52m and 5h 52m.
What does a yearly average hide?
A single bar per latitude answers one question, how much daylight per day on average, and hides the rest. The average is a rate with a hidden denominator, what we call the unstated per: here it is hours per day, averaged over the 365 dates of 2026. Shown alone, 12.58 hours at 70° N reads like a long, steady day.
The daily record says otherwise. At 70° N the Sun did not rise from January 1 to January 16 or from November 26 to December 31, and it did not set from May 17 to July 26. At the equator the longest and shortest days of 2026 differed by about one minute.
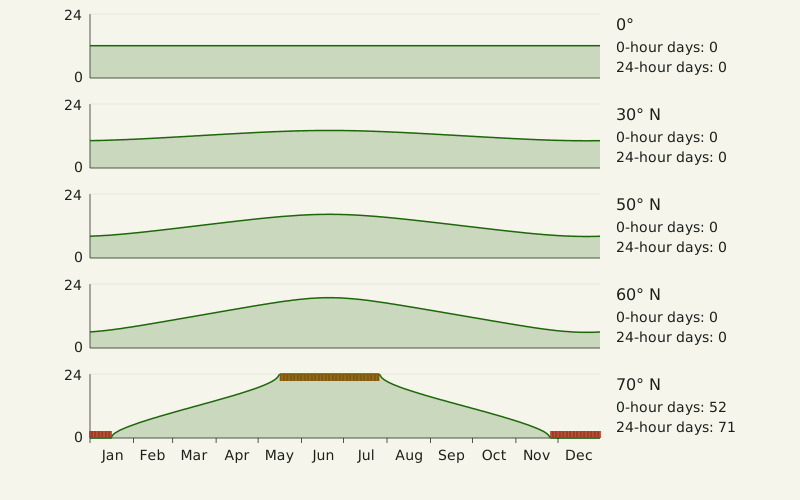
Figure: The Yardstick Almanac, CC BY 4.0
Credit line to copy
"Daylight at five latitudes, one panel each" by The Yardstick Almanac, https://theyardstickalmanac.com/reading-charts/daylight-hours-by-latitude/, licensed under CC BY 4.0 (https://creativecommons.org/licenses/by/4.0/).
Data: Daylight hours computed for 2026 from the USNO sunrise definition with the Meeus solar equations and the JPL DE440s ephemeris, 2026-11-01, CC BY 4.0
Small multiples fix this by giving each latitude its own panel on a shared scale. The eye compares shapes instead of single numbers, and the 0-hour and 24-hour stretches show up as flat runs. If a chart only has room for one number per place, the honest move is to say what was averaged and over what.
When does a cut axis mislead?
Start the vertical axis at 12 hours and the same two averages look far apart. In the left panel below, the bar for 70° N is 4.8 times as long as the bar for the equator. With the axis starting at zero, the ratio is 1.04 to 1, the size of the real gap.
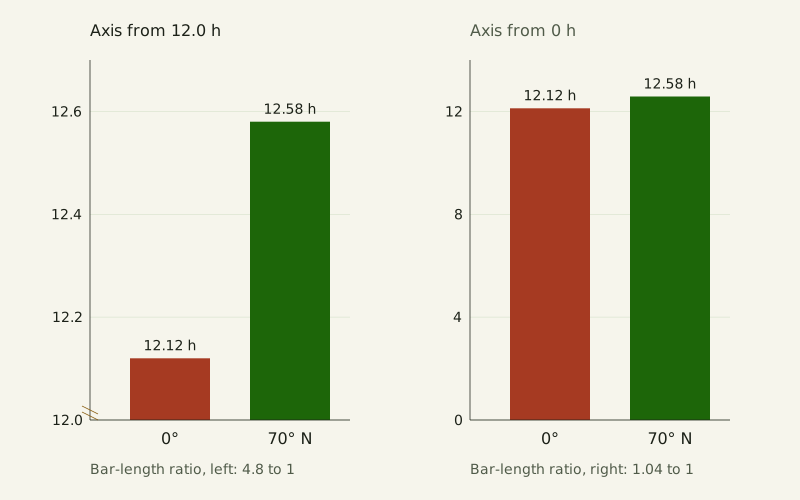
Figure: The Yardstick Almanac, CC BY 4.0
Credit line to copy
"A cut axis and a zero axis" by The Yardstick Almanac, https://theyardstickalmanac.com/reading-charts/daylight-hours-by-latitude/, licensed under CC BY 4.0 (https://creativecommons.org/licenses/by/4.0/).
Data: Daylight hours computed for 2026 from the USNO sunrise definition with the Meeus solar equations and the JPL DE440s ephemeris, 2026-11-01, CC BY 4.0
A bar encodes its value by its length, so a bar chart needs a zero baseline. The cut version gets the numbers on top of each bar right. The ratio is wrong, and the eye reads the ratio first. If small differences matter, a dot plot or a table of differences on a labeled axis shows them without inviting the wrong comparison.
Bars are read by length, and other chart types are read by other cues. A pie chart is a separate case, covered in how readers judge pie slices.
When do two axes invent a match?
A chart with two vertical axes can make any two series look related. In the left panel below, 60° N runs on the left axis from about 6 to 19 hours. The equator runs on the right axis, stretched to fill the same height, though its whole range is about one minute over the year.
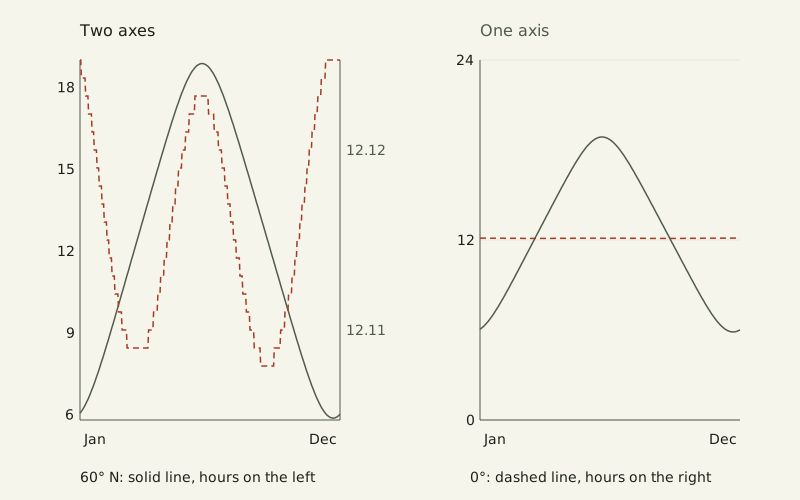
Figure: The Yardstick Almanac, CC BY 4.0
Credit line to copy
"Two axes and one axis" by The Yardstick Almanac, https://theyardstickalmanac.com/reading-charts/daylight-hours-by-latitude/, licensed under CC BY 4.0 (https://creativecommons.org/licenses/by/4.0/).
Data: Daylight hours computed for 2026 from the USNO sunrise definition with the Meeus solar equations and the JPL DE440s ephemeris, 2026-11-01, CC BY 4.0
On two axes, the equator's tiny wiggle crosses the 60° N curve several times and rises highest at the turn of the year, as if the two were trading places. On one shared axis, the equator is a flat line at about 12.1 hours and the 60° N curve swings about 13 hours. The crossings in the left panel come from where the two axes were placed, not from the data.
Two axes have a fair use when the units differ, for example hours and temperature. Even then, each axis range is a free choice, and the apparent match moves when either range moves.
What does a heatmap show that lines don't?
A heatmap puts latitude on one axis and date on the other and turns each day's hours into a shade. The chart below covers every 5 degrees from the equator to the North Pole. The darkest cells are 24-hour days and the empty cells are days with no daylight.
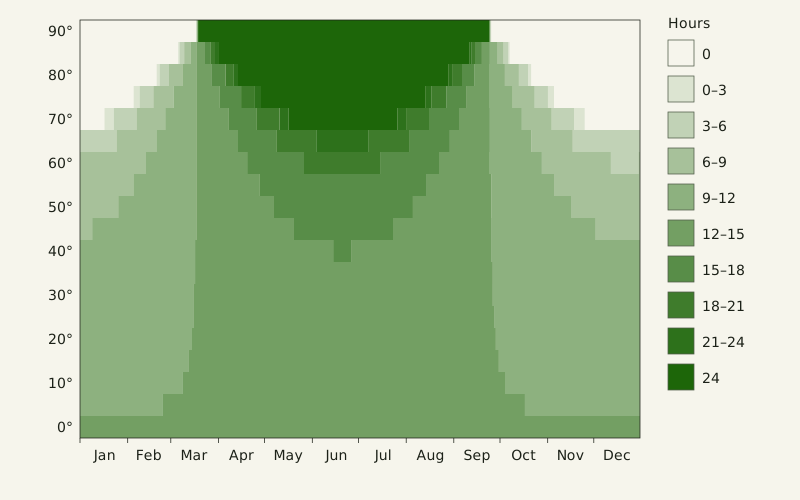
Figure: The Yardstick Almanac, CC BY 4.0
Credit line to copy
"Daylight by date and latitude, 2026" by The Yardstick Almanac, https://theyardstickalmanac.com/reading-charts/daylight-hours-by-latitude/, licensed under CC BY 4.0 (https://creativecommons.org/licenses/by/4.0/).
Data: Daylight hours computed for 2026 from the USNO sunrise definition with the Meeus solar equations and the JPL DE440s ephemeris, 2026-11-01, CC BY 4.0
Lines are better for reading one place closely. The heatmap is better for seeing the whole pattern at once: polar night widens row by row toward the pole, and around the equinoxes nearly every row shares the same middle shade. Shades are coarse, so the table below gives the same pattern as numbers.
| Latitude | March 20 | June 21 | September 23 | December 21 |
|---|---|---|---|---|
| 0° | 12h 07m | 12h 07m | 12h 06m | 12h 08m |
| 10° N | 12h 07m | 12h 43m | 12h 06m | 11h 33m |
| 20° N | 12h 07m | 13h 21m | 12h 06m | 10h 55m |
| 30° N | 12h 07m | 14h 05m | 12h 07m | 10h 13m |
| 40° N | 12h 08m | 15h 01m | 12h 07m | 9h 20m |
| 50° N | 12h 10m | 16h 22m | 12h 08m | 8h 04m |
| 60° N | 12h 13m | 18h 52m | 12h 10m | 5h 52m |
| 70° N | 12h 18m | 24h 00m | 12h 15m | 0h 00m |
| 80° N | 12h 36m | 24h 00m | 12h 30m | 0h 00m |
| 90° N | 24h 00m | 24h 00m | 24h 00m | 0h 00m |
March 20 and September 23 were the dates of the 2026 equinoxes in UTC. On both, every latitude in the table got more than 12 hours, for the reason covered in the section on the Arctic's extra light.
What does a box plot add?
A box plot draws a set of values as five points: the lowest, the highest, the median and the two values that fence in the middle half. For daylight, the set is the 365 dates of 2026 at one latitude (leap years add a 366th date). The diamond marks the mean, so the box and the yearly average sit on the same chart.
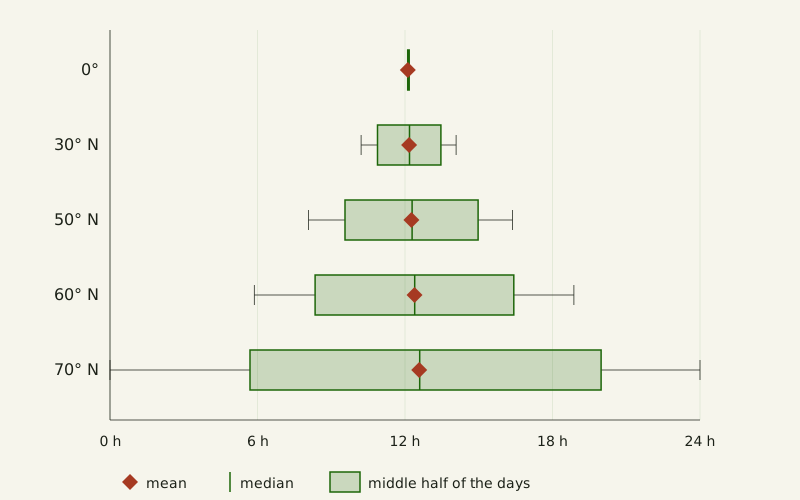
Figure: The Yardstick Almanac, CC BY 4.0
Credit line to copy
"Box plots of daily daylight, 2026" by The Yardstick Almanac, https://theyardstickalmanac.com/reading-charts/daylight-hours-by-latitude/, licensed under CC BY 4.0 (https://creativecommons.org/licenses/by/4.0/).
Data: Daylight hours computed for 2026 from the USNO sunrise definition with the Meeus solar equations and the JPL DE440s ephemeris, 2026-11-01, CC BY 4.0
At the equator the whole box is a sliver around 12.12 hours. At 70° N the middle half of the dates runs from 5.7 to 20.0 hours, the median is 12.6 hours and the whiskers reach 0 and 24. The mean and median sit almost on top of each other at every latitude, so neither one tells you how wide the box is.
Why does the Arctic get extra light?
USNO defines sunrise and sunset as the moments the top edge of the Sun's disk touches the horizon. For computing, it puts the Sun's center at a geometric zenith distance of 90.8333 degrees [exact by definition], 50 arcminutes below the horizon. In USNO's words, that 50 arcminutes comes from “adding the average apparent radius of the Sun (16 arcminutes) to the average amount of atmospheric refraction at the horizon (34 arcminutes).”
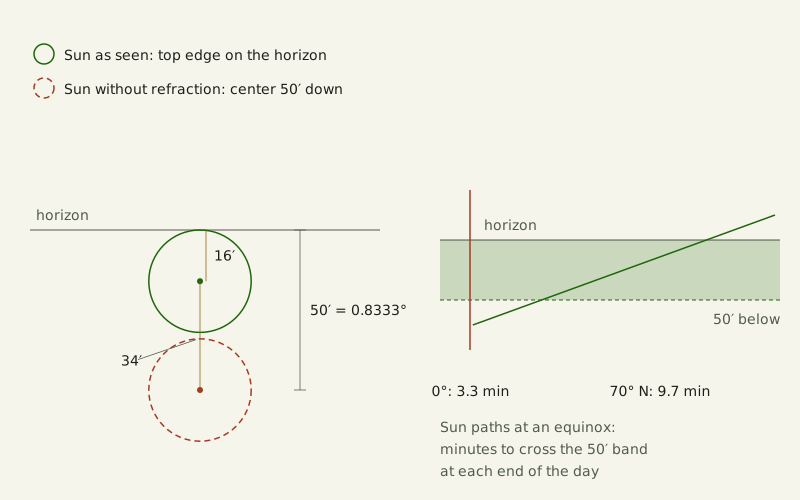
Figure: The Yardstick Almanac, CC BY 4.0
Credit line to copy
"The 50 arcminutes behind a sunrise" by The Yardstick Almanac, https://theyardstickalmanac.com/reading-charts/daylight-hours-by-latitude/, licensed under CC BY 4.0 (https://creativecommons.org/licenses/by/4.0/).
Data: Daylight hours computed for 2026 from the USNO sunrise definition with the Meeus solar equations and the JPL DE440s ephemeris, 2026-11-01, CC BY 4.0
The 50 arcminutes is the same everywhere, but the time it takes is not. At the equator the Sun rises straight up, so at an equinox it clears the 50 arcminutes in about 3.3 minutes at each end of the day. At 70° N its path meets the horizon at a shallow slant, and the same climb takes about 9.7 minutes. USNO's page on day and night lengths says this excess “is greater the higher the latitude because the path of the Sun at rising and setting is at a smaller angle with the horizon.”
Averaged over the year, the standard definition adds about 7 minutes a day at the equator and about 23 at 70° N, compared with counting only the time the Sun's center is above the horizon. The gain is largest at 65° N in our 5-degree grid, about 26 minutes a day.
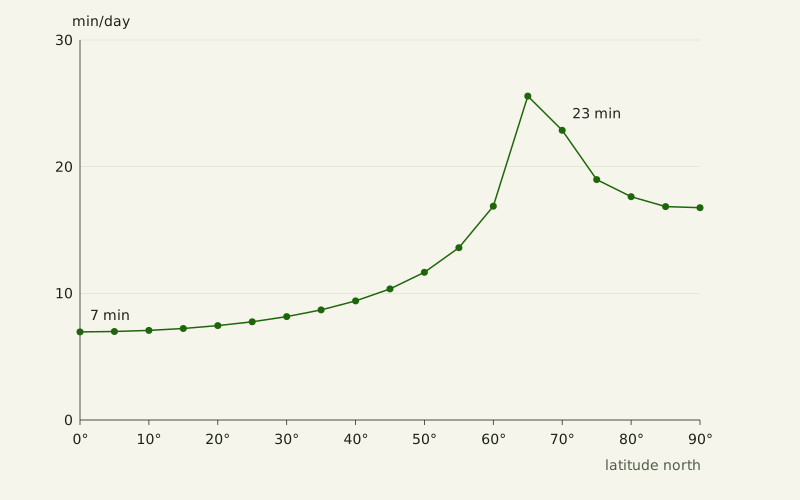
Figure: The Yardstick Almanac, CC BY 4.0
Credit line to copy
"Extra daylight from the standard sunrise definition" by The Yardstick Almanac, https://theyardstickalmanac.com/reading-charts/daylight-hours-by-latitude/, licensed under CC BY 4.0 (https://creativecommons.org/licenses/by/4.0/).
Data: Daylight hours computed for 2026 from the USNO sunrise definition with the Meeus solar equations and the JPL DE440s ephemeris, 2026-11-01, CC BY 4.0
That is only part of the lead. Counting the Sun's center alone, 70° N still averaged 12.20 hours to the equator's 12.00.
Real sunrises vary around these numbers. USNO warns that computed rise and set times “may be in error by a minute or more” even under ideal conditions and that the error grows at high latitudes, where small changes in refraction move the times by many minutes. The averages here describe the definition, not what a particular shoreline will show on a particular day.
Is it the same at 70° S?
No: by the standard definition, 70° S averaged about 12.18 hours a day in 2026 [estimate, range 12.15–12.22 h], ahead of the equator but well behind 70° N. As with the other averages, the range allows a minute of error at each sunrise and sunset. By the center definition 70° S averaged 11.80 hours, behind the equator, while 70° N averaged 12.20. In the south the standard definition's extra minutes are what lift 70° S above the equator.
The north's head start comes from the calendar of the Sun's path. Between the March and September equinoxes of 2026 the Sun's center stayed north of the equator for about 186.4 days; from the September equinox to the next March one it stayed south for about 178.8. USNO's page on the seasons notes that Earth's orbit is slightly elliptical and that Earth passes closest to the Sun in early January, about two weeks after the December solstice.
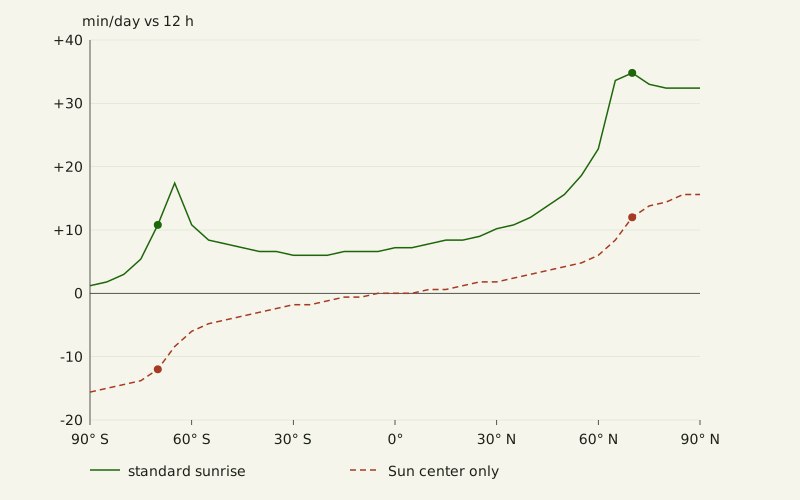
Figure: The Yardstick Almanac, CC BY 4.0
Credit line to copy
"Daylight against 12 hours, pole to pole" by The Yardstick Almanac, https://theyardstickalmanac.com/reading-charts/daylight-hours-by-latitude/, licensed under CC BY 4.0 (https://creativecommons.org/licenses/by/4.0/).
Data: Daylight hours computed for 2026 from the USNO sunrise definition with the Meeus solar equations and the JPL DE440s ephemeris, 2026-11-01, CC BY 4.0
With the center definition, every northern latitude averaged a little over 12 hours and every southern latitude a little under, by up to about 15 minutes at the poles. The standard definition adds its extra minutes on both sides, so every southern latitude in our grid still ended up above 12 hours, if only by about a minute at the South Pole. The largest southern average in our 5-degree grid was 12.29 hours, at 65° S.
When is there a midnight sun?
Here a midnight-sun day is a date when the Sun stays up for all 24 hours. By the standard definition none of the latitudes up to 65° N had one in 2026, though 65° N came close with a longest day of 22.04 hours. At 70° N there were 71 such days, and at the North Pole 190.
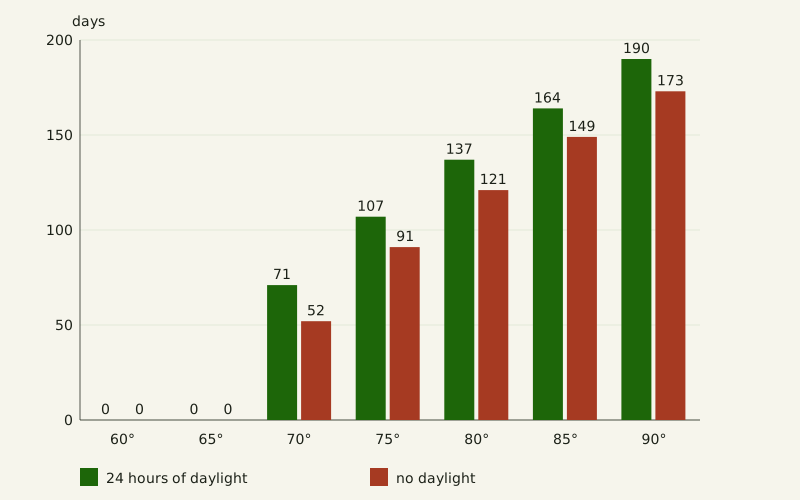
Figure: The Yardstick Almanac, CC BY 4.0
Credit line to copy
"Days with 24 hours of daylight and with none, 60° to 90° N" by The Yardstick Almanac, https://theyardstickalmanac.com/reading-charts/daylight-hours-by-latitude/, licensed under CC BY 4.0 (https://creativecommons.org/licenses/by/4.0/).
Data: Daylight hours computed for 2026 from the USNO sunrise definition with the Meeus solar equations and the JPL DE440s ephemeris, 2026-11-01, CC BY 4.0
| Latitude | Days with 24 hours of daylight | Days with no daylight | 24-hour days, center definition | No-daylight days, center definition |
|---|---|---|---|---|
| 65° N | 0 | 0 | 0 | 0 |
| 70° N | 71 | 52 | 63 | 60 |
| 75° N | 107 | 91 | 103 | 97 |
| 80° N | 137 | 121 | 133 | 127 |
| 85° N | 164 | 149 | 160 | 153 |
| 90° N | 190 | 173 | 186 | 177 |
Days with 24 hours of daylight outnumber days with none at every latitude in the table from 70° N up, under both definitions. The standard definition widens that gap: at 70° N it turns 8 dark days into partial days and adds 8 days of midnight sun. At 75° N our two computations differ by one day on the edge of polar night, 91 against 92, because the Sun's center sat within about 0.004 degrees of the threshold at midday.
"Summer Night, Raftsundet, Lofoten" by Adelsteen Normann, public domain
Full credit
"Summer Night, Raftsundet, Lofoten" by Adelsteen Normann — https://commons.wikimedia.org/wiki/File:Adelsteen_Normann_-_Sommernatt_i_Raftsund_-_TKM-29-1887_-_Trondheim_kunstmuseum_(cropped).jpg — Public domain (Oil on canvas by Adelsteen Normann (1848–1918), Trondheim Art Museum TKM-29-1887, dated presumably 1887 on the Commons file page; the painter died 26 December 1918, so the work is in the public domain in Norway and the EU (life plus 70 years) and in the United States (published before 1931, per the file page). Faithful photographic reproduction of a two-dimensional public-domain work (PD-Art); the file is marked with the Public Domain Mark 1.0); modified: cropped to the painting by a Commons contributor (CropTool, lossless) from the framed museum photograph; used unchanged
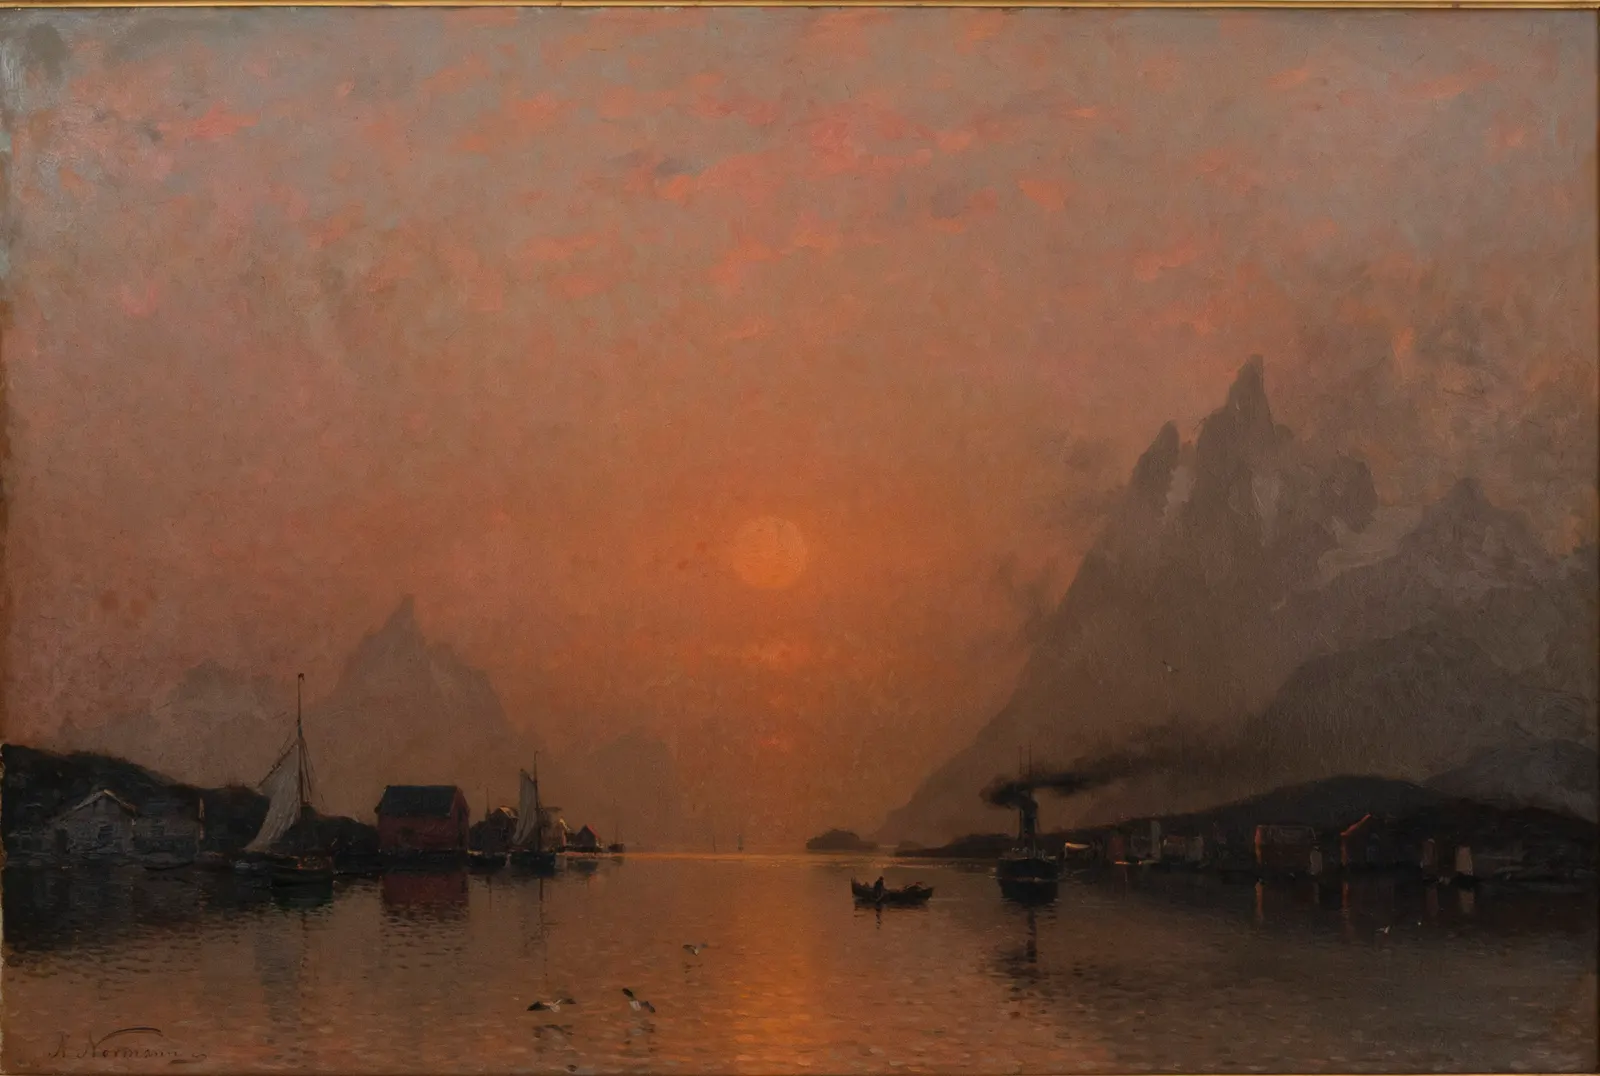
The title calls the scene a summer night, and the canvas does not say whether that Sun went on to set. If you go looking for a low Sun like this one, watch the shadows or the water, not the Sun itself.
Daylight hours questions
How was a day's daylight counted?
For each latitude we added up the time the Sun was up during each UTC date of 2026, from midnight to midnight, at sea level on the 0° meridian with a level horizon. One computation uses the solar equations from Jean Meeus's Astronomical Algorithms that NOAA's calculator documentation names; the other reads the Sun's position from JPL's DE440 ephemeris. At the five latitudes in the charts their standard-definition hours agree within 47.1 seconds on every date.
Near the poles the gap reached about 18 minutes on the few days when the Sun barely touched the threshold. NOAA's page says its sunrise and sunset results are theoretically accurate to within a minute between 72° N and 72° S and within 10 minutes beyond, so 70° N sits just inside that line.
Is a day at the equator really 12 hours?
Counting the Sun's center, the equator averaged 12.00 hours in 2026. By the standard definition its days ran from 12h 06m to 12h 08m, so the sunrise convention adds about 7 minutes to every equatorial day. USNO's equinox page compares the day with the night instead: on the equinoxes “the day is about 7 minutes longer than the night at latitudes up to about 25 degrees.”
Our March 20 at the equator was 12h 07m: about 7 minutes more than 12 hours, but about 13 minutes more than the 11h 53m of night left in that date. We can think of this as a closure error between two benchmarks. USNO's day-and-night page, which adds the 50 arcminutes at both ends of the day and takes the same time off the night, implies the 13-minute figure. The equinox page's 7 minutes, and its 10 minutes at 50 degrees, match the gap between the day and 12 hours instead: our 50° N day on March 20 was 12h 10m.
Why do days change length fastest near the equinoxes?
Day length changes fastest around the March and September equinoxes and slowest near the solstices. In 2026 the fastest change at 60° N was 5.48 minutes in one day, in mid-March. At 50° N the peak was 3.77 minutes and at 30° N 1.82 minutes, also in mid-March; at the equator the daily change never reached a tenth of a minute.
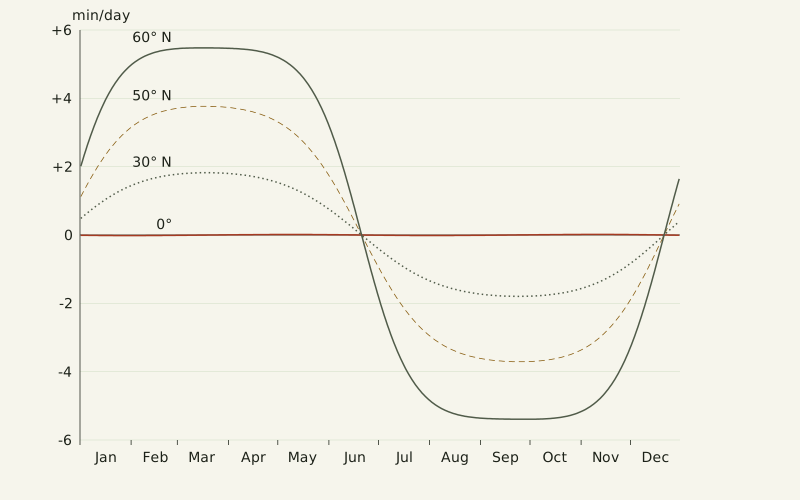
Figure: The Yardstick Almanac, CC BY 4.0
Credit line to copy
"How fast day length changes, 2026" by The Yardstick Almanac, https://theyardstickalmanac.com/reading-charts/daylight-hours-by-latitude/, licensed under CC BY 4.0 (https://creativecommons.org/licenses/by/4.0/).
Data: Daylight hours computed for 2026 from the USNO sunrise definition with the Meeus solar equations and the JPL DE440s ephemeris, 2026-11-01, CC BY 4.0
The pattern follows the Sun's declination, its angle north or south of the equator. In our computation the declination moved about 0.4 degrees a day around the March equinox and less than 0.01 degrees a day on June 21. Near the poles the pattern breaks: at 70° N the biggest jump came on January 17, when the first sunrise after polar night added 59 minutes at once. The rate chart leaves 70° N out because one jump of that size would flatten the other four lines.
Sources
- U.S. Naval Observatory, Astronomical Applications Department, "Rise, Set, and Twilight Definitions." https://aa.usno.navy.mil/faq/RST_defs Read: full page
- U.S. Naval Observatory, Astronomical Applications Department, "Comparative Lengths of Days and Nights." https://aa.usno.navy.mil/faq/longest_day Read: full page
- U.S. Naval Observatory, Astronomical Applications Department, "Length of Day and Night at the Equinoxes." https://aa.usno.navy.mil/faq/equinoxes Read: full page
- U.S. Naval Observatory, Astronomical Applications Department, "The Seasons and the Earth's Orbit." https://aa.usno.navy.mil/faq/seasons_orbit Read: full page
- NOAA Global Monitoring Laboratory, "Solar Calculation Details" (NOAA Solar Calculator documentation). https://gml.noaa.gov/grad/solcalc/calcdetails.html Read: full page
Data files (computed 2026-11-01 for a sea-level site on the 0° meridian, each UTC date of 2026, with our own implementation of the Meeus solar equations used by NOAA's solar calculator, cross-checked against the Skyfield 1.55 Python package, MIT license, with JPL's DE440s ephemeris; each file comes with a notes file giving its sources and license):
- Daily daylight hours, 2026, 0° to 90° N every 5° (CSV, source and license notes) Data: Daylight hours computed for 2026 from the USNO sunrise definition with the Meeus solar equations and the JPL DE440s ephemeris, 2026-11-01, CC BY 4.0
- Yearly averages and polar day and night counts, 90° S to 90° N every 5° (CSV, source and license notes) Data: Daylight hours computed for 2026 from the USNO sunrise definition with the Meeus solar equations and the JPL DE440s ephemeris, 2026-11-01, CC BY 4.0
Cite this page
The Yardstick Almanac. "Daylight Hours: 70° N Averaged More Than the Equator in 2026." Published November 1, 2026. https://theyardstickalmanac.com/reading-charts/daylight-hours-by-latitude/. Accessed [the date you read it].
More in Reading Charts

Reading Charts
Misleading Graphs: In Tests, Even Flagged Cut Axes Misled
Illustration credit
Illustration: The Yardstick Almanac. Generated schematic illustration — not a photograph or historical record. © The Yardstick Almanac, all rights reserved.
Reading Charts
Pie Chart: A 2019 Study Says Readers Likely Judge Area
Illustration credit
Illustration: The Yardstick Almanac. Generated schematic illustration — not a photograph or historical record. © The Yardstick Almanac, all rights reserved.
How this page is checked: Where the numbers come from explains the value tags, the source order and how every figure is recomputed.
Corrections: every substantive change is logged in What we got wrong.
Spotted an error? Email contact@theyardstickalmanac.com with the sentence and your source, or read Write in first.