Misleading Graphs: In Tests, Even Flagged Cut Axes Misled
The Yardstick Almanac Published No substantive revisions
Short answer
In three experiments published in 2020, a bar chart with a cut y-axis made a change look bigger to participants, even when a break mark flagged the cut.
Station index 9 sections
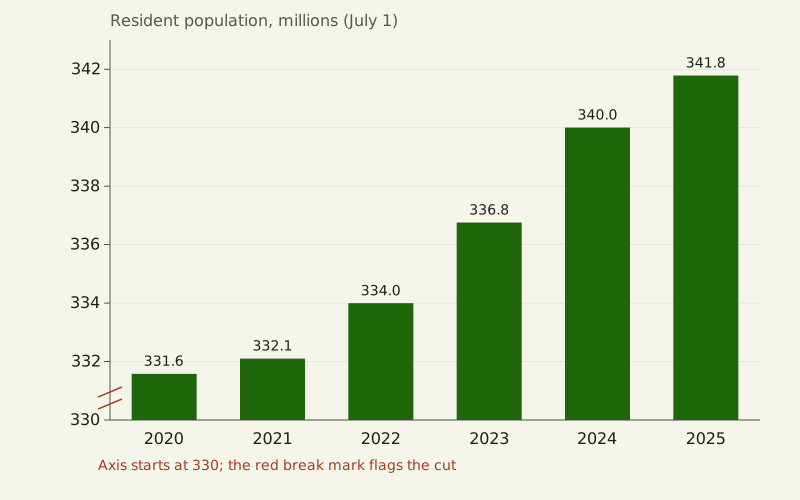
Figure: The Yardstick Almanac, CC BY 4.0
Credit line to copy
"Population bars on a cut axis" by The Yardstick Almanac, https://theyardstickalmanac.com/reading-charts/misleading-graphs/, licensed under CC BY 4.0 (https://creativecommons.org/licenses/by/4.0/).
Data: Computed from U.S. Census Bureau Vintage 2025 population estimates (NST-EST2025-ALLDATA, released January 2026, public domain), retrieved 2026-11-01, CC BY 4.0
In 2020 experiments, bars starting at 50% instead of zero made the same change look bigger, even when flagged. The work is by Michael Correll, Enrico Bertini and Steven Franconeri, presented at the CHI 2020 conference, and it ran three online experiments with 40, 32 and 25 recruited participants. Some charts marked the cut with a broken axis, and some asked people to estimate the first and last values; the inflated impression stayed. This page rebuilds six such tricks from one federal data file, and each trick turns out to be a choice that buys one thing and gives up another.
A misleading graph usually has correct numbers. The fault is in the drawing, which invites a comparison the data do not support, such as a ratio between bars that is not the ratio between values. Below, each of six tricks is drawn twice from the U.S. Census Bureau's Vintage 2025 population estimates, once the misleading way and once the honest way: a cut axis, two value axes, periods of unequal length, a running total, a count with no denominator, and 3D perspective.
Why does a flagged cut axis still mislead?
A bar shows its value by its length, so two bars invite a ratio. In the chart at the top of this page, U.S. resident population went from 331.6 million on July 1, 2020, to 341.8 million on July 1, 2025 [measured, source gives no uncertainty]. That is a rise of 3.1%. Because the axis starts at 330 million, the 2025 bar is drawn 7.5 times as tall as the 2020 bar.
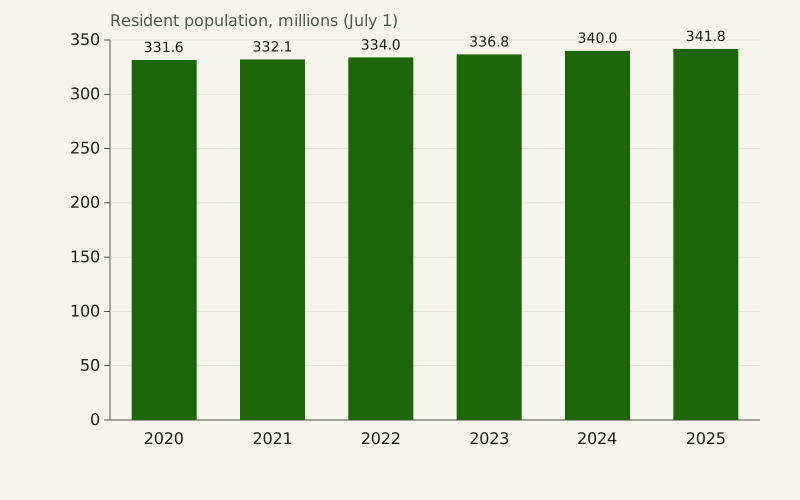
Figure: The Yardstick Almanac, CC BY 4.0
Credit line to copy
"Population bars on a zero axis" by The Yardstick Almanac, https://theyardstickalmanac.com/reading-charts/misleading-graphs/, licensed under CC BY 4.0 (https://creativecommons.org/licenses/by/4.0/).
Data: Computed from U.S. Census Bureau Vintage 2025 population estimates (NST-EST2025-ALLDATA, released January 2026, public domain), retrieved 2026-11-01, CC BY 4.0
| July 1 | Resident population | Bar height, axis from 330 million | Bar height, axis from zero |
|---|---|---|---|
| 2020 | 331.6 million | 1.6 million above the cut | 331.6 million |
| 2025 | 341.8 million | 11.8 million above the cut | 341.8 million |
| Ratio, 2025 to 2020 | 1.03 | 7.5 | 1.03 |
The cut version prints the right numbers on every bar, so a careful reader can undo it. Correll and colleagues tested whether readers do.
In their first experiment, 40 recruited participants rated how big the change between values looked in bar and line charts whose value axis began at 0, 25 or 50% of the range. More truncation gave higher ratings, and bar charts and line charts behaved about the same. On their 1-to-5 scale, starting at 25% instead of 0 raised the average rating by 0.36 [measured, source gives no uncertainty].
Did marking the cut help?
The second experiment, with 32 people, added two designs meant to flag the cut: bars with a visible break and an axis break, and bars that fade out at the bottom. The paper found no significant difference between these designs and plain truncated bars.
In the third experiment, 25 people also typed in the first and last values before rating the change. Their errors in the estimated change did not grow with truncation, yet their ratings still did. From these results the authors write that merely indicating truncation, “even in a prominent and unambiguous way, may not be sufficient” to undo the bias.
A second study points the same way, though we read only its abstract. Brenda Yang, Camila Vargas Restrepo, Matthew Stanley and Elizabeth Marsh, in the Journal of Applied Research in Memory and Cognition in 2021, report five studies in which a truncated y-axis made differences look larger. According to the abstract, the effect persisted after viewers were taught about truncation, 83.5% of participants across the five studies showed it [measured, source gives no uncertainty], and graph literacy failed to predict its size.
An earlier paper, Pandey and colleagues at CHI 2015, is cited by Correll et al. for finding that people rate differences as greater in bar charts that do not start at zero. We have only its bibliographic record, so its methods and numbers are not used here.
When is it fine not to start the axis at zero?
Correll and colleagues do not conclude that every axis must include zero. They note that the person who picks the axis range controls how big a difference looks, and that no single rule settles how big it should look. A line chart encodes values by position, not length, so a tight range can be the honest choice when small changes matter, as long as the range is labeled.
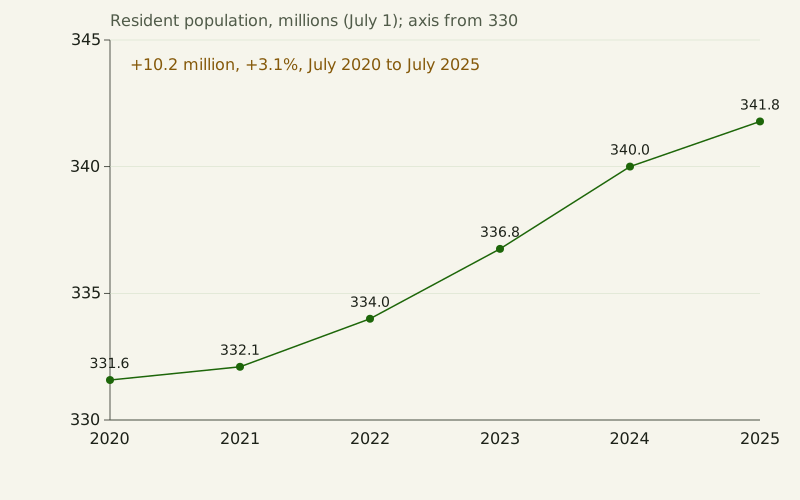
Figure: The Yardstick Almanac, CC BY 4.0
Credit line to copy
"Population line on a labeled range" by The Yardstick Almanac, https://theyardstickalmanac.com/reading-charts/misleading-graphs/, licensed under CC BY 4.0 (https://creativecommons.org/licenses/by/4.0/).
Data: Computed from U.S. Census Bureau Vintage 2025 population estimates (NST-EST2025-ALLDATA, released January 2026, public domain), retrieved 2026-11-01, CC BY 4.0
The line above starts at 330 million and says so in the axis title. It also writes the change in words, 10.2 million people or 3.1% in five years, so the slope cannot do all the talking. A logarithmic axis is another honest departure from zero when values span many powers of ten; the light-travel ladder in Grace Hopper's nanosecond uses one.
The working rule on this site is narrower than a blanket zero rule. A bar chart needs a zero baseline, because a bar is read by its length. A line chart may zoom, but then the axis title should state where it starts and the text should give the change as a number. That rule does not undo the experimental result: in Correll's first experiment, line charts on cut axes inflated ratings about as much as bars did.
Why are dual-axis charts misleading?
Put two series on two value axes and you choose where each one sits. In the chart below, U.S. births run on the left axis and deaths on the right, each axis fitted to its own range. As drawn, the deaths line starts far above the births line in the twelve months to June 30, 2021, and the two lines meet at the top a year later.
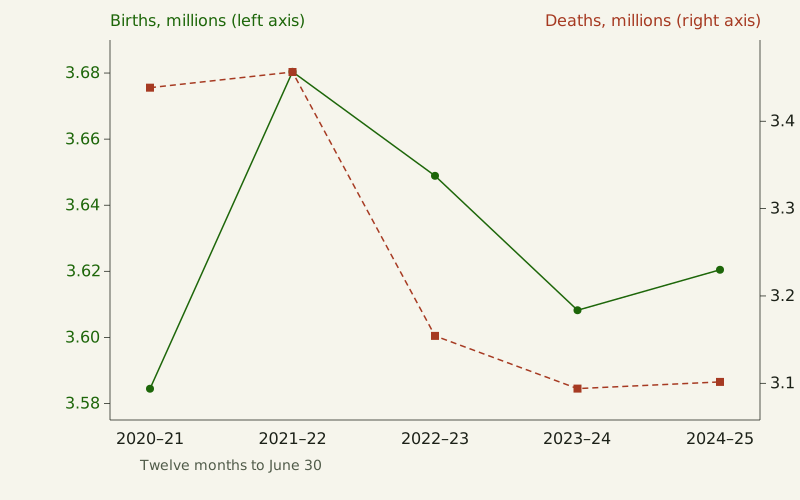
Figure: The Yardstick Almanac, CC BY 4.0
Credit line to copy
"Births and deaths on two axes" by The Yardstick Almanac, https://theyardstickalmanac.com/reading-charts/misleading-graphs/, licensed under CC BY 4.0 (https://creativecommons.org/licenses/by/4.0/).
Data: Computed from U.S. Census Bureau Vintage 2025 population estimates (NST-EST2025-ALLDATA, released January 2026, public domain), retrieved 2026-11-01, CC BY 4.0
The crossing is made by the axes, not the data. On one shared axis, births were higher than deaths in every twelve-month period, by 146 thousand in 2020–21 and by 519 thousand in 2024–25 [measured, source gives no uncertainty]. The births line barely moves, and deaths fall away from it after 2021–22.
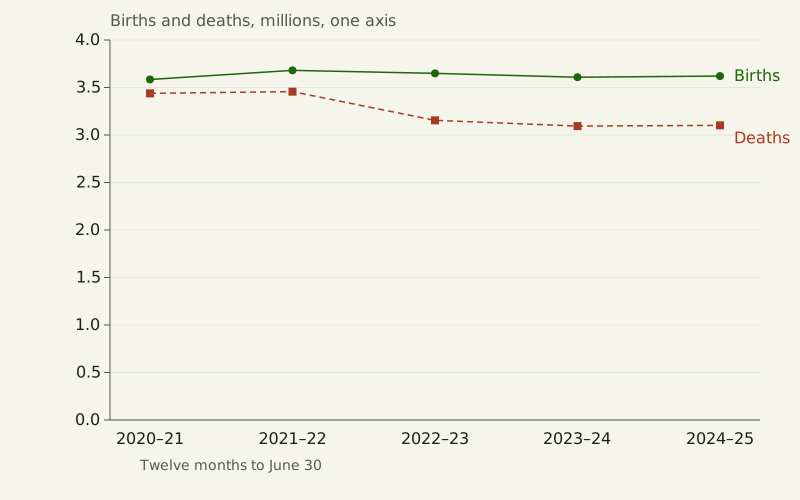
Figure: The Yardstick Almanac, CC BY 4.0
Credit line to copy
"Births and deaths on one axis" by The Yardstick Almanac, https://theyardstickalmanac.com/reading-charts/misleading-graphs/, licensed under CC BY 4.0 (https://creativecommons.org/licenses/by/4.0/).
Data: Computed from U.S. Census Bureau Vintage 2025 population estimates (NST-EST2025-ALLDATA, released January 2026, public domain), retrieved 2026-11-01, CC BY 4.0
| Twelve months to June 30 | Births | Deaths | Births minus deaths |
|---|---|---|---|
| 2020–21 | 3.58 million | 3.44 million | 146 thousand |
| 2021–22 | 3.68 million | 3.46 million | 224 thousand |
| 2022–23 | 3.65 million | 3.15 million | 495 thousand |
| 2023–24 | 3.61 million | 3.09 million | 514 thousand |
| 2024–25 | 3.62 million | 3.10 million | 519 thousand |
Two axes have a fair use when the units differ, such as hours and degrees, and even then each axis range is a free choice. The same trick is taken apart on a different dataset in daylight hours by latitude. If two series share a unit, as births and deaths do, one axis is the honest default.
When the point is how each series changed, an index does the job without a second axis. Set each series to 100 in its first period and plot both on one scale: by 2024–25, births stood at 101.0 and deaths at 90.2. The two lines then share one meaning, percent of the starting level, and any gap between them is real.
What happens when periods have different lengths?
The Census file reports births by period. The first period is short. It runs from April 1 to June 30, 2020, which is 91 days; every later period runs twelve months from July 1 to June 30. Drawn as six equal bars labeled by year, the first bar shows 894,123 births and looks about 75% lower than the next.
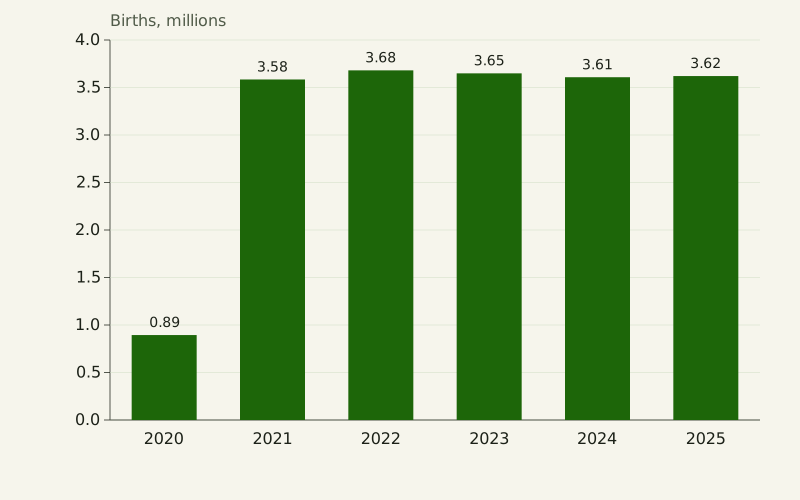
Figure: The Yardstick Almanac, CC BY 4.0
Credit line to copy
"Births in periods of unequal length" by The Yardstick Almanac, https://theyardstickalmanac.com/reading-charts/misleading-graphs/, licensed under CC BY 4.0 (https://creativecommons.org/licenses/by/4.0/).
Data: Computed from U.S. Census Bureau Vintage 2025 population estimates (NST-EST2025-ALLDATA, released January 2026, public domain), retrieved 2026-11-01, CC BY 4.0
The bars hide the unit of time behind each total, a case of what we call the unstated per: the denominator a number leaves out. Here it is “per period,” and the periods differ in length. Divide each total by the days in its period and the drop disappears: 9,826 births a day from April to June 2020 and 9,820 a day in the twelve months that followed [measured, source gives no uncertainty].
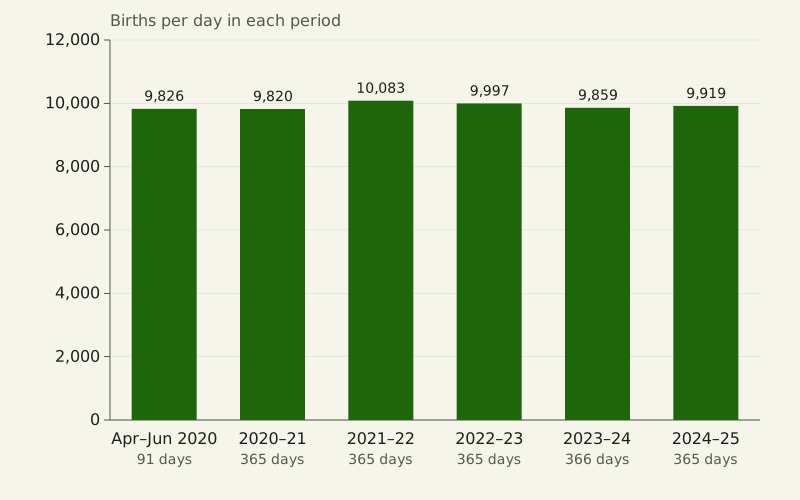
Figure: The Yardstick Almanac, CC BY 4.0
Credit line to copy
"Births per day in each period" by The Yardstick Almanac, https://theyardstickalmanac.com/reading-charts/misleading-graphs/, licensed under CC BY 4.0 (https://creativecommons.org/licenses/by/4.0/).
Data: Computed from U.S. Census Bureau Vintage 2025 population estimates (NST-EST2025-ALLDATA, released January 2026, public domain), retrieved 2026-11-01, CC BY 4.0
| Period | Days | Births | Births per day |
|---|---|---|---|
| April 1 to June 30, 2020 | 91 | 894,123 | 9,826 |
| July 2020 to June 2021 | 365 | 3,584,459 | 9,820 |
| July 2021 to June 2022 | 365 | 3,680,380 | 10,083 |
| July 2022 to June 2023 | 365 | 3,648,896 | 9,997 |
| July 2023 to June 2024 | 366 | 3,608,217 | 9,859 |
| July 2024 to June 2025 | 365 | 3,620,461 | 9,919 |
We counted the days in each period two independent ways and divided the file's totals by them. The same trap appears whenever a source mixes a partial year with full years, or a 28-day month with a 31-day one.
Is it a yearly amount or a running total?
A running total can only go up while its parts are positive. Add up U.S. deaths from April 1, 2020, and the line climbs every period, to 17.1 million by June 30, 2025 [measured, source gives no uncertainty]. Labeled only “Deaths,” it reads as if deaths rose every year.
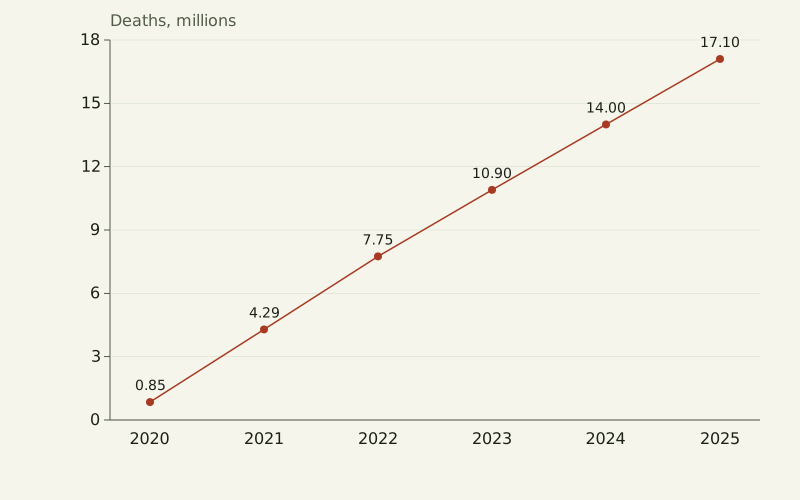
Figure: The Yardstick Almanac, CC BY 4.0
Credit line to copy
"Deaths as a running total" by The Yardstick Almanac, https://theyardstickalmanac.com/reading-charts/misleading-graphs/, licensed under CC BY 4.0 (https://creativecommons.org/licenses/by/4.0/).
Data: Computed from U.S. Census Bureau Vintage 2025 population estimates (NST-EST2025-ALLDATA, released January 2026, public domain), retrieved 2026-11-01, CC BY 4.0
Year by year the picture is different. Deaths peaked at 3.46 million in the twelve months to June 30, 2022, and fell to 3.09 million two years later, a drop of 10.5% [measured, source gives no uncertainty]. The running total kept rising through that drop, because each year still added more than three million deaths.
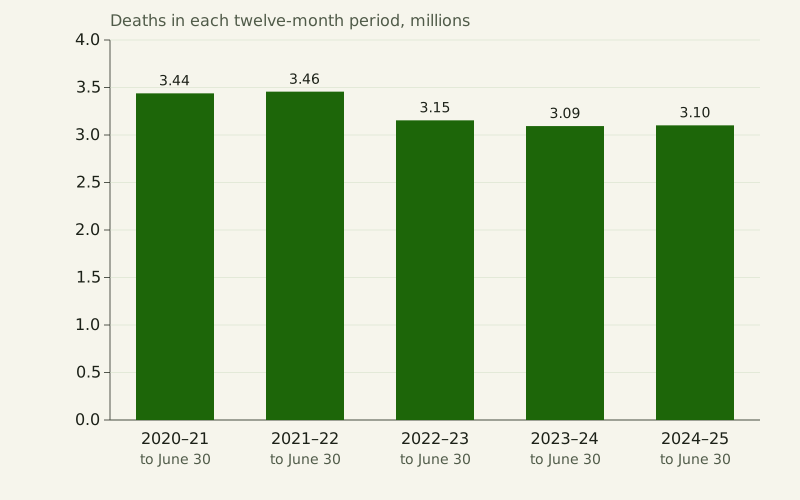
Figure: The Yardstick Almanac, CC BY 4.0
Credit line to copy
"Deaths in each twelve-month period" by The Yardstick Almanac, https://theyardstickalmanac.com/reading-charts/misleading-graphs/, licensed under CC BY 4.0 (https://creativecommons.org/licenses/by/4.0/).
Data: Computed from U.S. Census Bureau Vintage 2025 population estimates (NST-EST2025-ALLDATA, released January 2026, public domain), retrieved 2026-11-01, CC BY 4.0
| Period ending June 30 | Deaths in period | Running total since April 1, 2020 |
|---|---|---|
| 2020 (3 months) | 0.85 million | 0.85 million |
| 2021 | 3.44 million | 4.29 million |
| 2022 | 3.46 million | 7.75 million |
| 2023 | 3.15 million | 10.90 million |
| 2024 | 3.09 million | 14.00 million |
| 2025 | 3.10 million | 17.10 million |
A running total has honest uses, such as showing how far a count has come toward a goal. The axis title should then say “total since” a stated date. If the question is whether something is rising, the chart should show the amount in each period.
Counts or rates: which states have the most births?
Rank states by births and you mostly rank them by population. In the twelve months to June 30, 2025, California had 398,632 births and Texas 390,203, far ahead of every other state.
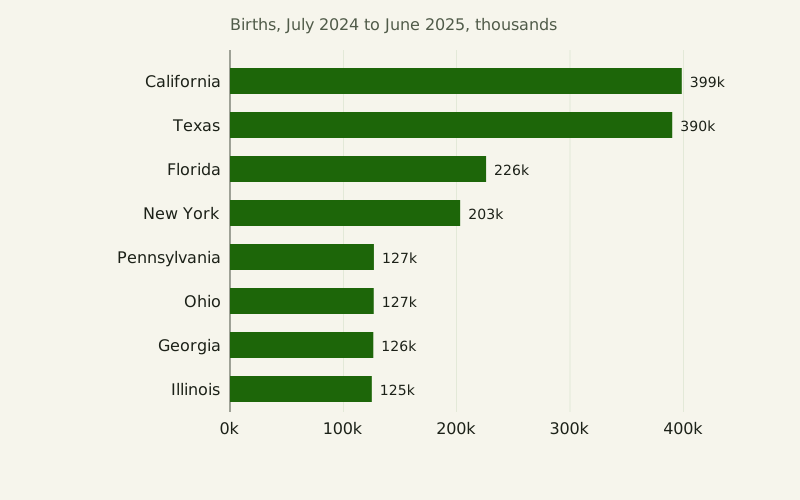
Figure: The Yardstick Almanac, CC BY 4.0
Credit line to copy
"Births by state, counts" by The Yardstick Almanac, https://theyardstickalmanac.com/reading-charts/misleading-graphs/, licensed under CC BY 4.0 (https://creativecommons.org/licenses/by/4.0/).
Data: Computed from U.S. Census Bureau Vintage 2025 population estimates (NST-EST2025-ALLDATA, released January 2026, public domain), retrieved 2026-11-01, CC BY 4.0
Divide by residents and the order changes. We used the average of the July 1, 2024, and July 1, 2025, population estimates as the denominator, as the file's notes describe; that gives the same rates as the birth-rate column in the Census file to six decimal places. Texas leads the eight at 12.4 births per 1,000 residents, while California, at 10.1, falls below the U.S. rate of 10.6 [measured, source gives no uncertainty].
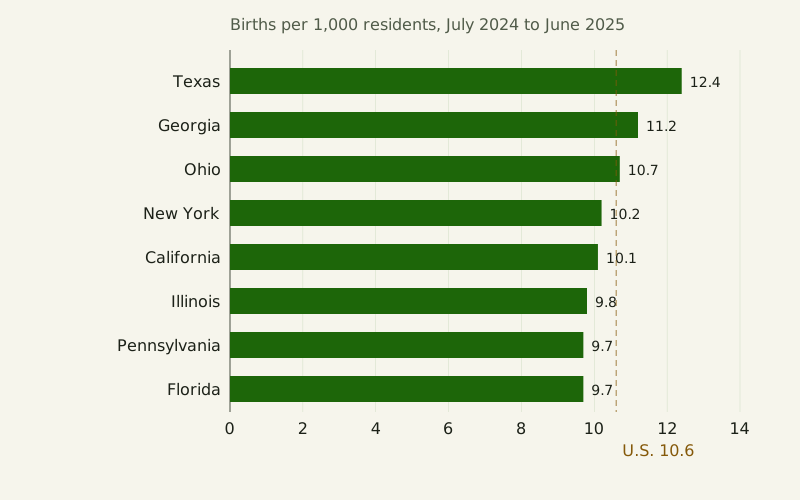
Figure: The Yardstick Almanac, CC BY 4.0
Credit line to copy
"Births by state per 1,000 residents" by The Yardstick Almanac, https://theyardstickalmanac.com/reading-charts/misleading-graphs/, licensed under CC BY 4.0 (https://creativecommons.org/licenses/by/4.0/).
Data: Computed from U.S. Census Bureau Vintage 2025 population estimates (NST-EST2025-ALLDATA, released January 2026, public domain), retrieved 2026-11-01, CC BY 4.0
| State | Births, July 2024 to June 2025 | Births per 1,000 residents | Rank of 51 by rate |
|---|---|---|---|
| California | 398,632 | 10.1 | 34 |
| Texas | 390,203 | 12.4 | 2 |
| Florida | 225,971 | 9.7 | 42 |
| New York | 203,078 | 10.2 | 33 |
| Pennsylvania | 126,981 | 9.7 | 41 |
| Ohio | 126,825 | 10.7 | 24 |
| Georgia | 126,446 | 11.2 | 16 |
| Illinois | 125,129 | 9.8 | 39 |
Five of the eight states with the most births had a birth rate below the U.S. rate. The highest rate among the 50 states and the District of Columbia was Utah's, 13.3 per 1,000, from 46.9 thousand births. Neither chart is wrong on its own; each answers a different question, and the count chart only misleads when it is offered as an answer about rates.
What does 3D do to a bar chart?
Drawing bars as boxes adds depth, and perspective shrinks whatever sits farther back. In the chart below, the four Census regions stand in a row receding from the viewer, each box scaled down by perspective. We set the scale for the four boxes at 1, 5/7, 5/9 and 5/11 from front to back [exact by definition], about 1, 0.71, 0.56 and 0.45.
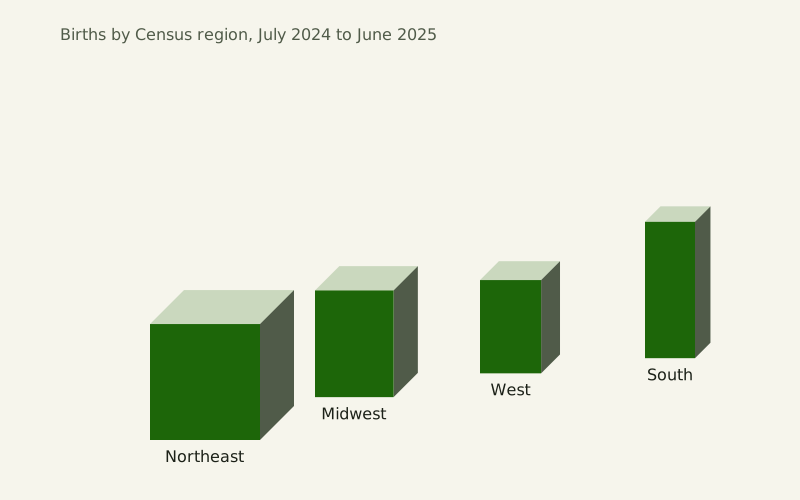
Figure: The Yardstick Almanac, CC BY 4.0
Credit line to copy
"Births by region in 3D perspective" by The Yardstick Almanac, https://theyardstickalmanac.com/reading-charts/misleading-graphs/, licensed under CC BY 4.0 (https://creativecommons.org/licenses/by/4.0/).
Data: Computed from U.S. Census Bureau Vintage 2025 population estimates (NST-EST2025-ALLDATA, released January 2026, public domain), retrieved 2026-11-01, CC BY 4.0
The South had 1,481 thousand births in the twelve months to June 30, 2025, which is 2.59 times the Northeast's 573 thousand [measured, source gives no uncertainty]. In the 3D chart the South's front face is drawn only 1.18 times as tall as the Northeast's. The West, with 829 thousand births, gets a shorter box than the Northeast.
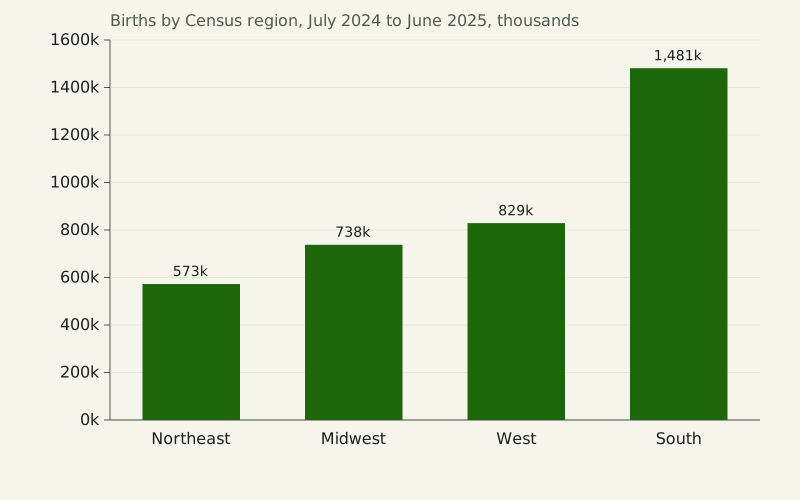
Figure: The Yardstick Almanac, CC BY 4.0
Credit line to copy
"Births by region, flat bars" by The Yardstick Almanac, https://theyardstickalmanac.com/reading-charts/misleading-graphs/, licensed under CC BY 4.0 (https://creativecommons.org/licenses/by/4.0/).
Data: Computed from U.S. Census Bureau Vintage 2025 population estimates (NST-EST2025-ALLDATA, released January 2026, public domain), retrieved 2026-11-01, CC BY 4.0
| Census region | Births, July 2024 to June 2025 | Drawn height in the 3D chart, Northeast = 1 | Drawn height in the flat chart, Northeast = 1 |
|---|---|---|---|
| Northeast | 573 thousand | 1.00 | 1.00 |
| Midwest | 738 thousand | 0.92 | 1.29 |
| West | 829 thousand | 0.80 | 1.45 |
| South | 1,481 thousand | 1.18 | 2.59 |
The South accounted for 41% of the four regions' births. Perspective is the extreme case, but even a 3D box without perspective adds a top and a side that carry no data.
Misleading graphs questions
Does knowing about the trick protect you?
Not reliably, in these experiments. In Correll's first experiment, 31 of the 40 participants answered a graph-literacy question about a truncated axis correctly, and 45% mentioned the axis manipulation in their comments afterward; a later passage of the paper gives that share as 47%. Their ratings still rose with truncation. The Yang et al. abstract reports that graph literacy failed to predict the size of the effect, and that PhD students in quantitative fields and in the humanities were both susceptible, the quantitative group slightly less so when no warning was given.
Can an axis that starts at zero mislead too?
It can hide a change that matters. On the shared 0 to 4 million axis above, the 2.7% rise in births from 2020–21 to 2021–22 is a few pixels. Correll and colleagues reject a simple split into honest and dishonest charts for this reason, and show examples, collected by Ben Jones, of chart types built around a baseline other than zero, such as index charts that compare everything to a starting value. The fix for a hidden change is to state it as a number and choose the chart type on purpose, not to cut the bars.
Where do the numbers on this page come from?
Every chart uses one file, the Census Bureau's Vintage 2025 national and state estimates, released in January 2026. Population counts are the bureau's estimates for July 1 of each year; births and deaths are its figures for each period. With each new vintage, the bureau revises the whole series back to the 2020 census, so later files may give different numbers for the same dates.
How can you tell if a graph is misleading?
None of the six tricks needs a false number. Each one changes what the eye compares. These questions check for them in order:

Illustration: The Yardstick Almanac. Generated schematic illustration — not a photograph or historical record. © The Yardstick Almanac, all rights reserved.
- Where does the value axis start? For bars, anything but zero makes the ratio between bars wrong.
- How many value axes are there? With two, the crossing points and overlaps come from the axis ranges.
- Are the periods the same length? A partial year or a short month drawn as a full step makes a fake drop.
- Is it a running total? Labels such as “since” or “to date” mean the line cannot fall while every added amount is positive.
- What is it per? A count by place mostly follows population; a rate needs a stated denominator.
- Is there depth or perspective? Compare printed values, not the size of the shapes.
| Trick | Misleading setting | Honest setting | Reading as drawn on this page | Reading from the data |
|---|---|---|---|---|
| Cut axis on bars | Axis from 330 million, break mark | Axis from zero | 2025 bar 7.5 times the 2020 bar | 1.03 times, a 3.1% rise |
| Two value axes | Each axis fitted to its own series | One shared axis | Deaths above births in 2020–21 | Births above deaths every period |
| Unequal periods | 91-day period drawn like a year | Births per day | First bar 75% lower | 9,826 a day, then 9,820 |
| Running total | Total since April 2020 | Deaths per period | Rising every period | Down 10.5% from the 2021–22 peak |
| Count, no denominator | Births by state | Births per 1,000 residents | California first | Texas first of the eight; California below the U.S. rate |
| 3D perspective | Boxes receding in depth | Flat bars | South 1.18 times the Northeast | 2.59 times |
The experiments above tested only the first trick. For the other five, the misleading reading shown here is what each drawing sets up, not a measured reader response.
Sources
- U.S. Census Bureau, Population Division, Annual Population Estimates, Estimated Components of Resident Population Change, and Rates of the Components of Resident Population Change for the United States, States, District of Columbia, and Puerto Rico: April 1, 2020 to July 1, 2025 (NST-EST2025-ALLDATA), Vintage 2025, released January 2026. https://www2.census.gov/programs-surveys/popest/datasets/2020-2025/state/totals/NST-EST2025-ALLDATA.csv Read: full data file
- U.S. Census Bureau, Population Division, NST-EST2025-ALLDATA file layout (data fields and periods), Vintage 2025. https://www2.census.gov/programs-surveys/popest/technical-documentation/file-layouts/2020-2025/NST-EST2025-ALLDATA.pdf Read: full document
- U.S. Census Bureau, Population Division, Population and Housing Unit Estimates: Methodology (technical documentation page, Vintage 2025 section), page last revised May 26, 2026. https://www.census.gov/programs-surveys/popest/technical-documentation/methodology.html Read: full page
- Michael Correll, Enrico Bertini and Steven Franconeri, “Truncating the Y-Axis: Threat or Menace?” Proceedings of the 2020 CHI Conference on Human Factors in Computing Systems. doi:10.1145/3313831.3376222. Preprint arXiv:1907.02035v2 (January 8, 2020). https://arxiv.org/abs/1907.02035 Read: full text (arXiv preprint, version 2)
- Brenda W. Yang, Camila Vargas Restrepo, Matthew L. Stanley and Elizabeth J. Marsh, “Truncating bar graphs persistently misleads viewers,” Journal of Applied Research in Memory and Cognition 10, no. 2 (2021): 298–311. doi:10.1016/j.jarmac.2020.10.002. https://doi.org/10.1016/j.jarmac.2020.10.002 Read: abstract only
- Anshul Vikram Pandey, Katharina Rall, Margaret L. Satterthwaite, Oded Nov and Enrico Bertini, “How Deceptive are Deceptive Visualizations?: An Empirical Analysis of Common Distortion Techniques,” Proceedings of the 2015 CHI Conference on Human Factors in Computing Systems (ACM, 2015), 1469–1478. https://arxiv.org/abs/1907.02035 Read: bibliographic record only (as cited by Correll et al. 2020)
Data files (computed 2026-11-01 from the U.S. Census Bureau's Vintage 2025 national and state population estimates file, a public-domain federal dataset released in January 2026; values are copied or divided as each file's notes describe, checked by a second independent calculation and against the drawn charts):
- Population, births and deaths used in every chart, April 2020 to July 2025 (CSV, source and license notes) Data: Computed from U.S. Census Bureau Vintage 2025 population estimates (NST-EST2025-ALLDATA, released January 2026, public domain), retrieved 2026-11-01, CC BY 4.0
- The six tricks: misleading and honest settings and the readings on this page (CSV, source and license notes) Data: Computed from U.S. Census Bureau Vintage 2025 population estimates (NST-EST2025-ALLDATA, released January 2026, public domain), retrieved 2026-11-01, CC BY 4.0
- The cut-axis studies: design, participants, findings and how much of each was read (CSV, source and license notes) Data: Study details transcribed from Correll, Bertini and Franconeri 2020 (full text), Yang et al. 2021 (abstract) and Pandey et al. 2015 (as cited by Correll et al.), 2026-11-01, CC BY 4.0
Cite this page
The Yardstick Almanac. "Misleading Graphs: In Tests, Even Flagged Cut Axes Misled." Published November 1, 2026. https://theyardstickalmanac.com/reading-charts/misleading-graphs/. Accessed [the date you read it].
More in Reading Charts

Reading Charts
Daylight Hours: 70° N Averaged More Than the Equator in 2026
Image credit
"Summer Night, Raftsundet, Lofoten" by Adelsteen Normann — https://commons.wikimedia.org/wiki/File:Adelsteen_Normann_-_Sommernatt_i_Raftsund_-_TKM-29-1887_-_Trondheim_kunstmuseum_(cropped).jpg — Public domain (Oil on canvas by Adelsteen Normann (1848–1918), Trondheim Art Museum TKM-29-1887, dated presumably 1887 on the Commons file page; the painter died 26 December 1918, so the work is in the public domain in Norway and the EU (life plus 70 years) and in the United States (published before 1931, per the file page). Faithful photographic reproduction of a two-dimensional public-domain work (PD-Art); the file is marked with the Public Domain Mark 1.0); modified: cropped to the painting by a Commons contributor (CropTool, lossless) from the framed museum photograph; used unchanged
Reading Charts
Pie Chart: A 2019 Study Says Readers Likely Judge Area
Illustration credit
Illustration: The Yardstick Almanac. Generated schematic illustration — not a photograph or historical record. © The Yardstick Almanac, all rights reserved.
How this page is checked: Where the numbers come from explains the value tags, the source order and how every figure is recomputed.
Corrections: every substantive change is logged in What we got wrong.
Spotted an error? Email contact@theyardstickalmanac.com with the sentence and your source, or read Write in first.